Olympic Hockey 2014: Is Team USA Just Better at Scoring Than Team Canada?
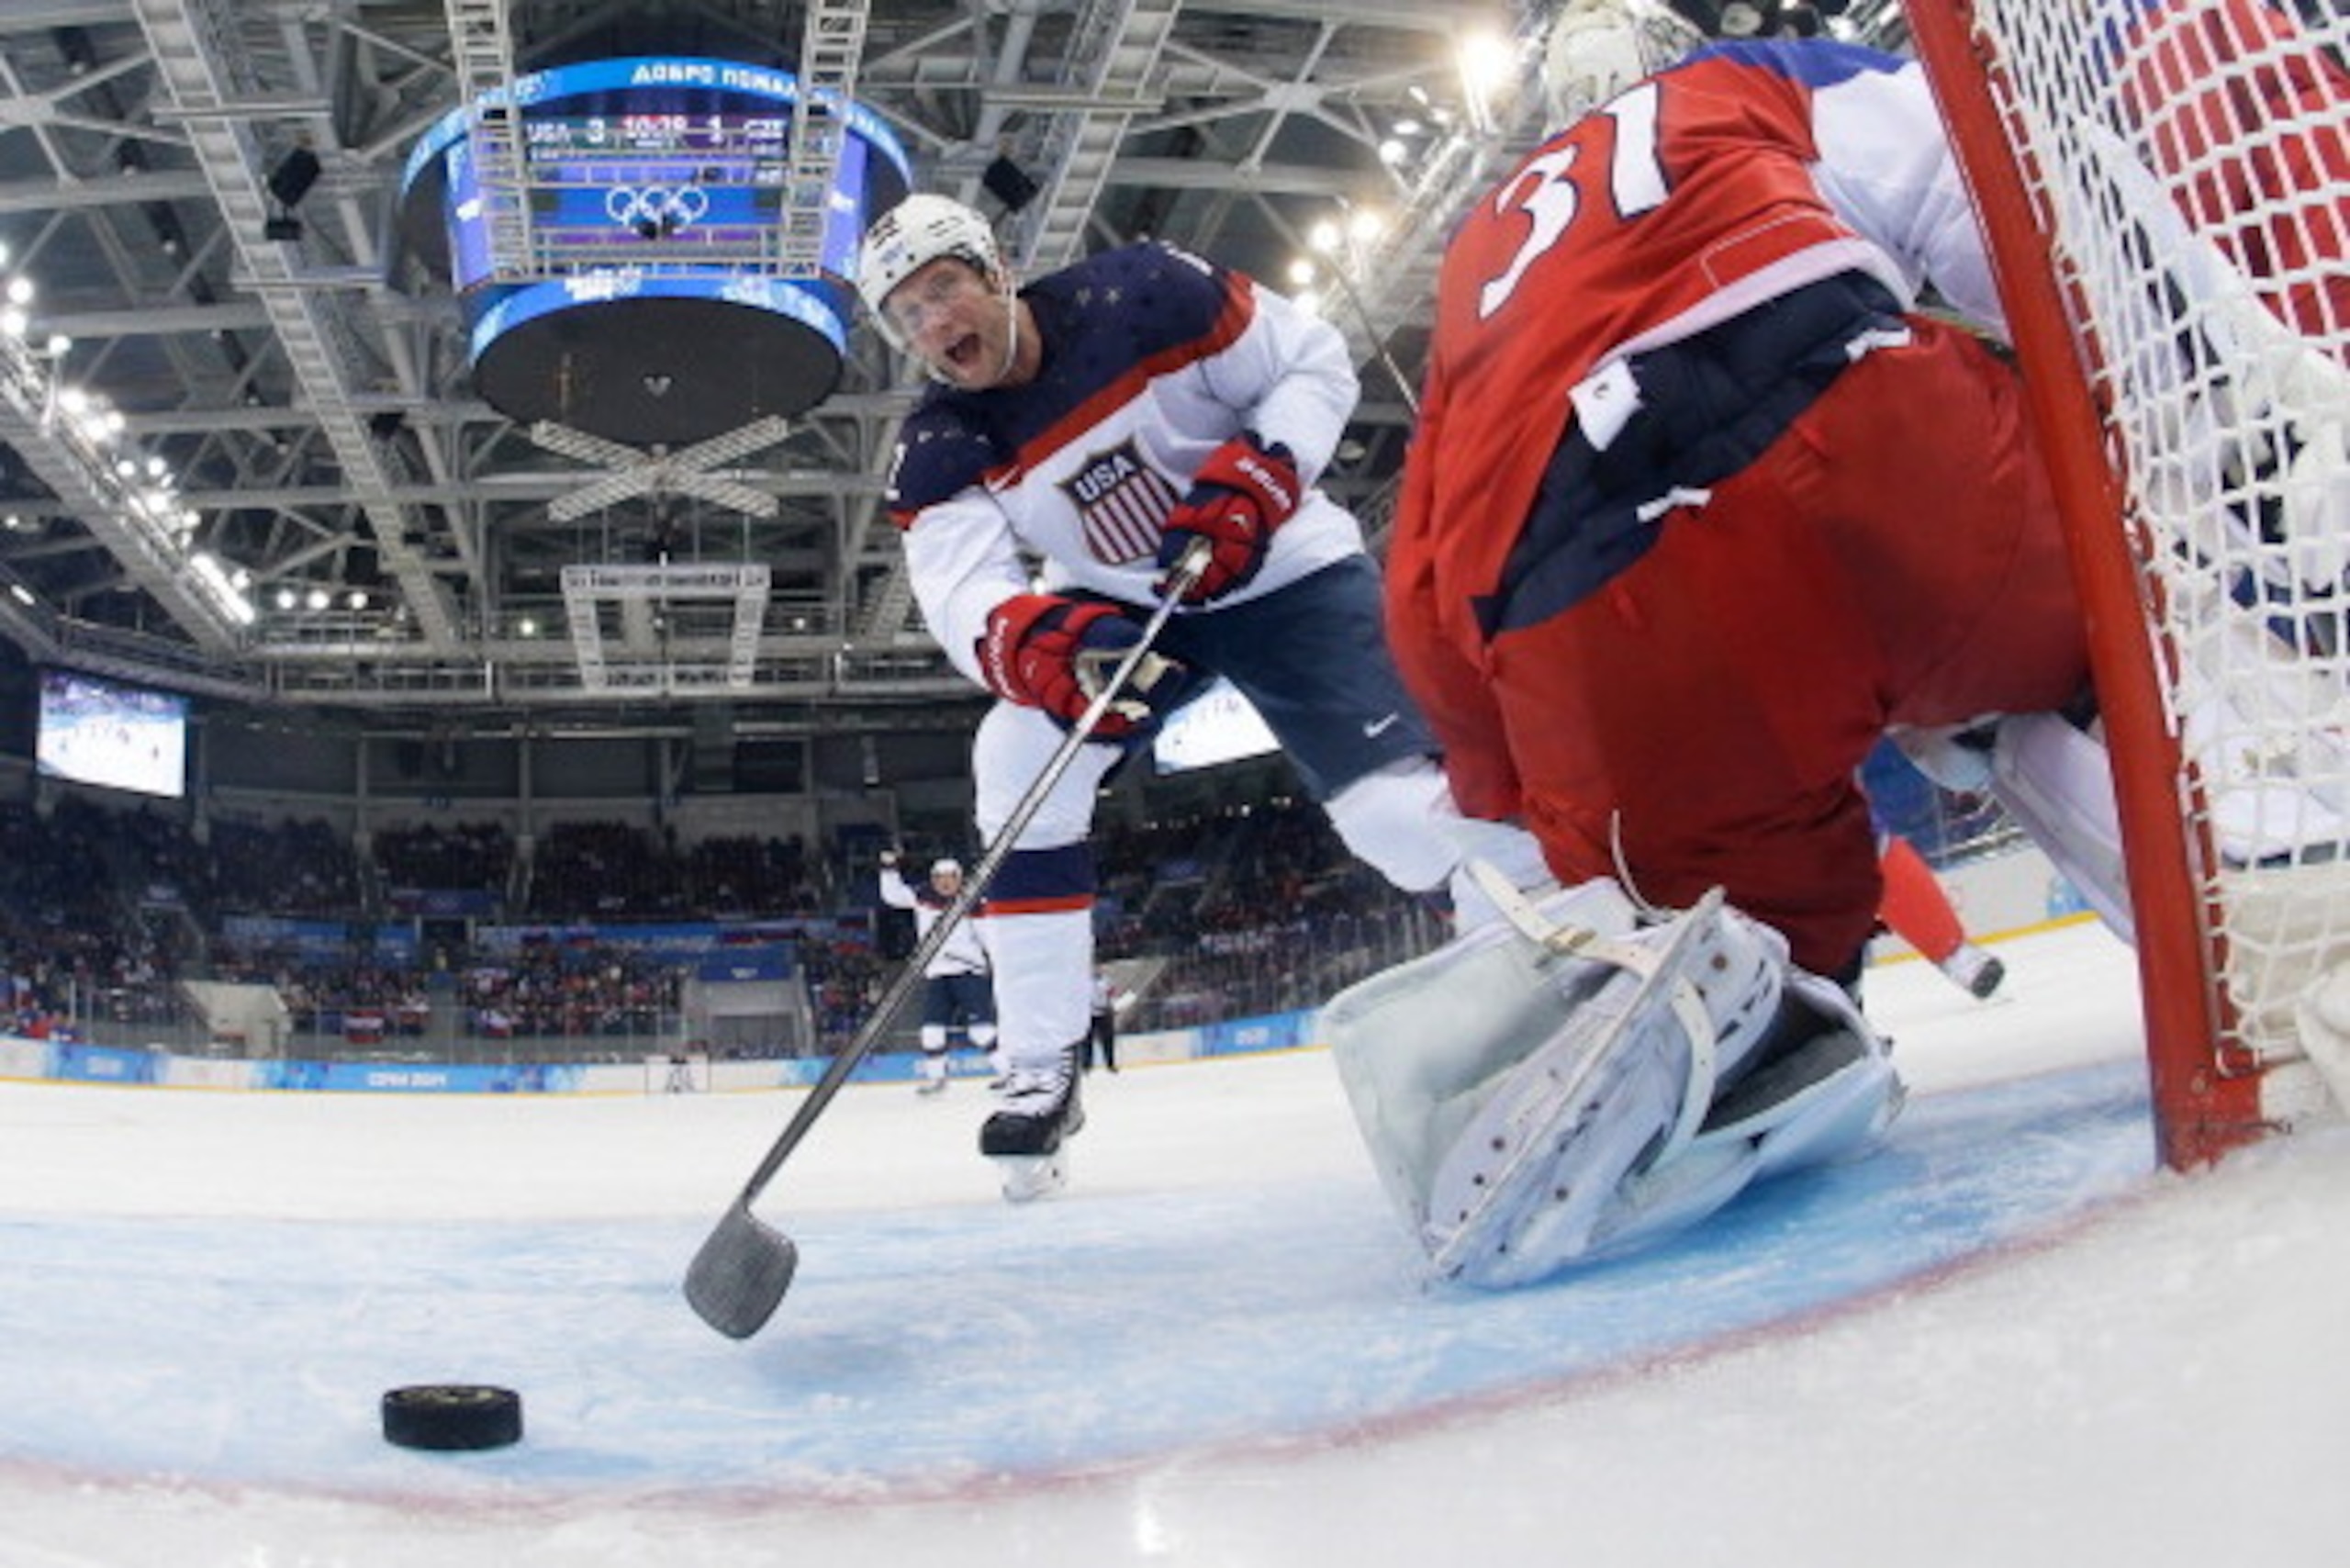
As the semifinals in men’s hockey draw near, it is all but impossible to miss the distinct contrast between the offence powering the Canadian and American entries. The United States has 20 goals, good for the tournament lead; Canada meanwhile has just 13, despite the fact that the Canadians have roughly three shots on net for every two the Americans have managed.
Is this simply the case of Team USA having better snipers than the Canadian team? Could it be that the American management group, knowing the hazards inherent in a single-game elimination tournament, opted to stack their roster with elite shooters to a degree that Canada couldn’t match?

.jpg?w=2560)
The consensus view among the hockey analytics community (laid out nicely at NHLNumbers.com by Eric Tulsky) is that there isn’t much gap in terms of shot quality between NHL teams, but NHL teams aren’t constructed the way Olympic rosters are. That means that what is true at the NHL level isn’t necessarily so in a best-on-best international tournament.
Still, if the U.S. team is stacked with first-shot scorers, that should be evident in the NHL results of the players selected to the team. If the Americans are better off in that regard than the Canadian team, we should expect to see that the players on that team, as a group, have a better shooting-percentage number than their Canadian counterparts.
To test that possibility, we took the shot totals for every individual player on the American and Canadian rosters and multiplied those shot totals by their NHL shooting percentages this season to create a projected goal total. What does the comparison look like?
| Team | Actual Goals | Projected Goals |
| Canada | 13 | 18 |
| United States | 20 | 14 |
The American shooters as a group this season had a slightly better average shooting percentage (10.9 percent) than the ones on the Canadian team (10.4 percent), but that wasn’t enough to compensate for Canada’s massive edge in shots. Assuming that Olympic goalies and NHL goalies are the same quality (more on that later), we would expect Canada to have five more goals than they do and the United States to have six fewer.
Shooting percentage, however, fluctuates dramatically from year to year. For example, on the Canadian side, Ryan Getzlaf is shooting at 19.2 percent this season; on his career he’s a significantly lower 12.6 percent.
What happens if we run the test again, this time using career numbers?
| Team | Actual Goals | Projected Goals |
| Canada | 13 | 18 |
| United States | 20 | 12 |
The gap gets even wider. The average shooting percentage of Canadian skaters using career numbers is the same as when using data from only this season (10.4 percent in both cases). American shooters have been hot this year, though, firing at a 10.9 percent average clip, when on their careers they have an average shooting rate of 9.3 percent.
Nor is it a case of a superior American strategy creating better scoring chances for its skaters than Canada has managed. Team Canada, by my count, has had 106 shots or missed shots from the scoring chances area to Team USA’s 79, meaning chances and shots have correlated almost exactly.
Does the explanation lie with the goalies? The following chart shows the starting goaltender in the games played by Canada and the United States:
| Game | Goalie | League | SV% |
| Canada G1 | Lars Haugen | KHL | 0.910 |
| Canada G2 | Bernhard Starkbaum | SHL | 0.931 |
| Canada G3 | Tuukka Rask | NHL | 0.928 |
| Canada G4 | Kristers Gudlevskis | AHL | 0.900 |
| USA G1 | Jaroslav Halak | NHL | 0.915 |
| USA G2 | Sergei Bobrovsky | NHL | 0.918 |
| USA G3 | Luca Gracnar | Austria | 0.925 |
| USA G4 | Ondrej Pavelec | NHL | 0.901 |
By eye, the U.S. has faced tougher goalies, with three NHL’ers (skeptics may feel free to add a "barely" in the case of Ondrej Pavelec) in four games. Canada has faced only one NHL starter, and was given the most trouble by Kristers Gudlevskis, a 21-year-old prospect with a middling background.
To recap: Team USA doesn’t have significantly better shooters than team Canada, either this season or using career numbers. It hasn’t created more scoring chances through innovative strategy. It hasn’t faced weaker goalies. How then do we explain the massive gap in goal scoring, given Canada’s shots dominance?
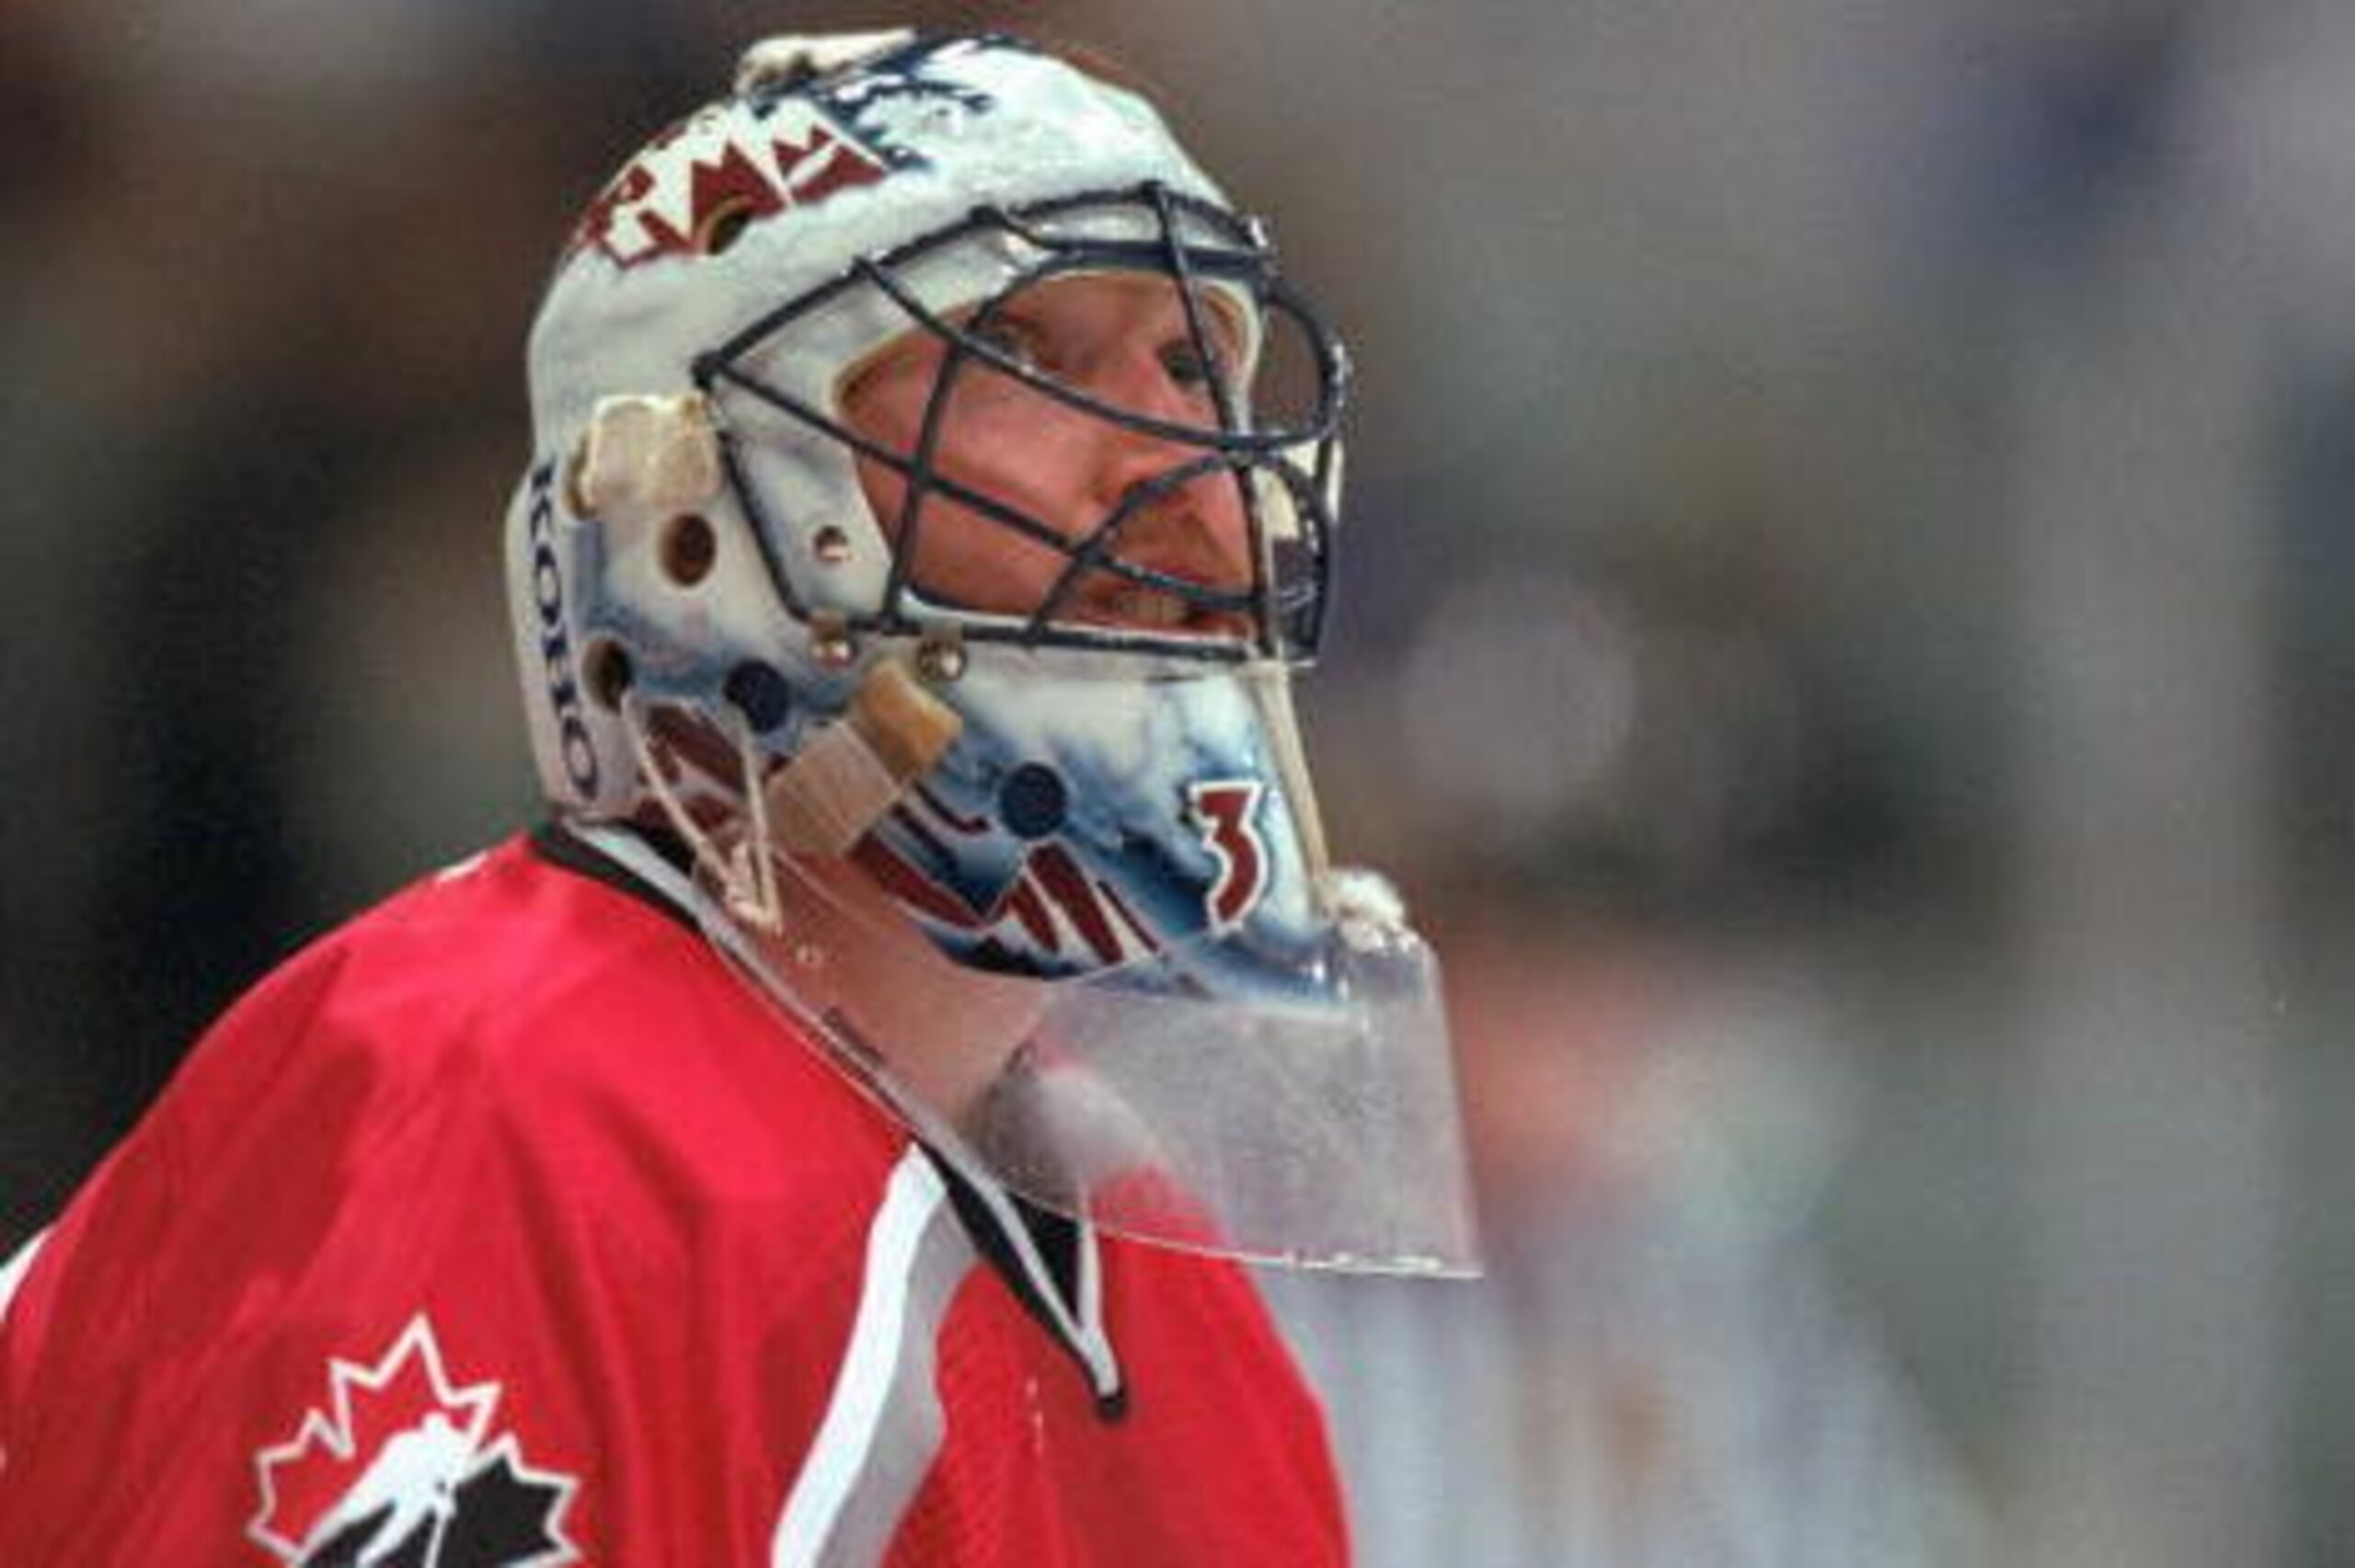
A story involving legendary goalie Patrick Roy offers a possible answer. Roy allowed five goals in one game on the road, and took criticism from the local media after the loss. Vic Ferrari of the blog Irreverent Oiler Fans takes the story from there:
"Roy was unflappable though, I heard him on the radio postgame show and he didn't think he'd played a bad game. His explanation for allowing five goals, by my memory; "they made their shots.” If shrugs made a sound, you would have been able to hear it.
"
Hockey is a game of tiny gaps, a game of bounces, and as such it is a game that variance has a huge impact on over the short term. Over the long haul, pure talent wins out, and things like shooting percentage move toward established averages.
But over four games? Over four games we can see things like two similarly talented groups of shooters posting divergent results. It would likely be a mistake to read anything more into it than that.
Statistics courtesy of IIHF.com, NHL.com and EliteProspects.com.



.jpg?w=2560 "Viral Rams Coach Vid 🖕")

.jpg?w=2560 "Injury-stricken Seahawks signing veteran RB")