Behind The USC Trojan's Scoring Decline - Part I
USC Trojan fans have fretted extensively the past two seasons as the team's offensive production has marginally declined. In hindsight this decline was somewhat inevitable after the 2005 season when the strongest offense in USC history largely departed for the NFL.
Still however the most recent Trojan squads did not match up to the level achieved by the 2002 to 2004 teams fielded by Head Coach Pete Carroll.
Whenever offensive points production falls off the normal fan and media tendency is to put all the blame on either the quarterback and/or the offensive coordinator. While this is indeed often the case there normally is more to the picture than initially meets the eye.
.jpg?w=256 "Big 12 Sorsby Gambling Basketball")


This article takes a closer look at USC football points production using five different categories across several years. The intent of the article is to analyze the points scored by the Trojans as well to identify the main sources of variation.
I did not fully include 2001 or 2002 in this study since the scoring drive charts were not all posted online by USC's Athletics Department for those games. For the few games I sampled however the same trend that I will explain below held true.
For starters lets review USC's total points production over the past seven years.
| Year | 2001 | 2002 | 2003 | 2004 | 2005 | 2006 | 2007 | '01-'07 Average |
| Points Per Game | 26.55 | 35.77 | 41.08 | 38.15 | 49.08 | 30.46 | 32.62 | 36.24 |
A more detailed look on a game-by-game basis is contained in this next graphic below as well. The following trend chart below includes the game-by-game average, a linear trend fit, and a sixth order polynomial trend fit as well for the entire period.
The lowest year in terms of points scored during the Pete Carroll era for USC is 2001 at 26.55 points per game in his first overall season at the helm. The highest level is of course the 2005 Trojan edition at 49.08 points per game when Matt Leinart, Reggie Bush, LenDale White, Steve Smith, Dwayne Jarrett, and others lined up on offense.
The average points per game scored for USC over the seven year span is an impressive 36.24 points per game. The past two years however have been on the lower side of this figure.
(Note: Keep in mind that the 2006 season in college football was effectively 10% shorter due to changes in the game clock rules that year. I will not adjust for that effect but any cross year comparison should probably bump those figures up by roughly that amount.)
A big problem however with looking at the scoring data at this aggregate level is that the total combines so many different factors it is hard to sort out with respect potential sources of the variation. For example in football:
- The defense scores points at times on safeties, interceptions or fumbles recovered and returned for scores
- Special team units can score points on punt and kick off returns for touchdowns or blocked kicks
- Teams typically score on offense at a higher percentage after turnovers by the defense
- Teams can score on short field (SF) scores (less that half the field) after blocked kicks, or turnovers, or excellent kick returns
- Teams can score starting from normal medium field (MF) position starting around the 30 yard line
- Teams can score on long field (LF) drives of 85 to 90 yards or more
Each of these categories is indicative of a different relative strength or weakness in a given year. The first four categories for example are reflective of how defense and special teams play directly and indirectly contribute to scoring by the offense.
The latter two cases are more reflective of the true offensive capability in my opinion since those involve sustaining drives the length of the field. It is worth looking at each of these closer in detail for greater insight into how a team actually scores. For simplicity I chose to break things into the five categories listed below.
Category 1 = Defense or Special Teams Scoring.
Category 2 = Scores on offense after a turnover (TO) caused by the defense.
Category 3 = Other scores (Non turnover related) or short field (SF) drives starting on the opponents 1 to 50 yard line.
Category 4 = Medium field (MF) drives for TD by the offense without the benefit of turnovers and starting between the USC 21 and 49 yard line.
Category 5 = Long field (LF) drives for TD by the offense without the benefit of a turnover and starting between the USC 1 to 20 yard line.
Here is the five year summary in terms of a) scoring drives and then b) points:
| Category | Scoring Explanation | 2003 | 2004 | 2005 | 2006 | 2007 |
| 1 | Defense or Special Teams | 11 | 3 | 4 | 3 | 0 |
| 2 | Scores off TO's | 18 | 22 | 22 | 12 | 18 |
| 3 | Non TO SF drive (1-50) | 12 | 9 | 10 | 4 | 9 |
| 4 | Non TO MF drive (49-21) | 26 | 37 | 28 | 32 | 28 |
| 5 | Non TO LF drive (20-1) | 22 | 9 | 34 | 15 | 15 |
| Sum Total | 89 | 80 | 98 | 66 | 70 |
Converting the scoring data into more the familiar points look results in the following numbers:
| Category | Scoring Explanation | 2003 | 2004 | 2005 | 2006 | 2007 |
| 1 | Defense or Special Teams | 5.1 | 1.6 | 2.1 | 1.7 | 0.0 |
| 2 | Scores off TO's | 8.1 | 10.0 | 11.2 | 5.8 | 8.1 |
| 3 | Non TO SF drive (1-50) | 5.2 | 4.2 | 4.7 | 1.8 | 4.5 |
| 4 | Non TO MF drive (49-21) | 11.8 | 17.8 | 14.1 | 13.5 | 12.9 |
| 5 | Non TO LF drive (20-1) | 10.9 | 4.5 | 17.0 | 7.7 | 7.1 |
| Total | 41.1 | 38.1 | 49.1 | 30.5 | 32.6 |
As you can see the sub-totals move around a bit and are pretty interesting once you start comparing the sections with each other across time. I will put them into bar chart format for easier viewing and explanation purposes. Let's start with Category 1—direct scoring by either the defense or special teams.
These initial numbers are not large but they are still significant. The 2003 edition of USC football for example was amazing in that the defense and special teams scored almost a dozen times in one season without the offense ever taking the field.
There were two safeties as well as five interceptions returned for TD (Will Poole, Lofa Tatupu, Jason Leach, Ronald Nunn, and Omar Nazel one each). In addition there were four fumbles returned for touchdown (two by Mike Patterson, and one each by Ronald Nunn, and Kenechi Udeze).
That amount alone accounts for 67 points of the USC total scoring offense that season or an impressive 5.1 points per game on average. Each squad afterwards has scored fewer points in this manner and the 2007 edition was the first team of the Pete Carroll era to be shut out on defense or special teams in terms of scoring.
Even in 2006 LB Brian Cushing scored once versus Notre Dame on an on-side kick off return and CB Terrell Thomas scored once versus Stanford on a blocked kick for example.
Of course direct scoring by the defense and special teams is one thing but contribution of good field position and positive momentum is another to be considered.
In the Rose Bowl game ABC put up the following picture in the game in the fourth quarter reflecting points production after turnovers in the 2008 Rose Bowl game.
Sudden "momentum shifts" after turnovers are forced by the defense clearly benefit the offense and subsequently affect how teams score for a couple of reasons. Of course there is the psychological advantage to the offense in these cases.
In addition, however, is the simple gain in terms of relative field position. The average spot over the past few years after the USC defense forces a turnover is roughly the opponent's 40-yard line.
After a turnover the offense starts with a "short field" advantage and only has to move about 10 yards to get into field goal range and 40 yards to score a touchdown.
USC is about 70% likely to score from such a spot the last time I checked. Combining the points in the first rows from above (direct scores by defense and special teams) along with points scored after a turnover the past five years you get the following result for categories one and two.
As you can see that is a pretty interesting insight. A very significant amount of USC scoring in any given season is a product of either direct scores by the defense or special teams, beneficial short field position, or the momentum created after turnovers by the defense.
This result becomes important when you also consider the trend the past several seasons for USC football in terms of net turnover margin (see below).
For this turnover trend data I'll go back to 2002 since the information is easily obtainable.
The blue columns indicate the turnovers forced on defense by either fumbles or interceptions. The middle bar is the number of turnovers committed by USC on offense. The third and lightest colored bar is the differential for the year (i.e. turn over margin).
Quite disturbingly turnovers forced by USC have fallen the past two years while turnovers by the offense spiked in 2007.
For USC the turnover differential has been extremely small now for two consecutive seasons. That may sound insignificant but remember that the average field position after a turnover is the opponents 40-yard line for USC.
From 2002 to 2005 that meant 38 to 42 drives per year that started *on average* inside the opponents half of the field. From there USC is highly likely to score roughly 70% of the time by my calculations.
When there is no turnover forced by the defense USC or any team instead gets the ball back via punt for example and loses 40 or so yards of field position and starts around or inside its 20 yard line.
Conversely when USC commits a turnover it in turn gives the opponent a shorter field to work with as well. That net effect is large and troubling when I look further at the data.
Of course even where there is not a turnover USC often gets a nice kick off return, punt return or the occasional shanked punt, etc. to help field position.
Those instances all can provide USC with short field position in a variety of subtle ways. I calculated those effects separately as Category 3 instances from the table above. Adding up rows one through three above now provides a complete total of all short scores (i.e. less than 50 yard drives), as well as points after turnovers, and points directly scored by the defense.
The trend now starts to become somewhat alarming when these three components are added together. As you can see below the USC offense the past two years clearly has not benefited from short field scoring opportunities as much as it has in previous years.
(Note: I sampled four games for 2002 and it was roughly the same picture.)
Next here is what is left over when you strip away the first three categories and see what the offense can do when it starts on its own side of the field and has to travel at least 50 yards to score and does not have the sudden momentum change advantage stemming from a turnover.
The following chart reflects Categories 4 and 5 put together and shows what the Trojan offense has done in terms of points production when starting on its own side of the field.
In my opinion this is the most accurate measurement solely of offensive points capability since it nets out most of the help often provided by special teams or defense. The result is surprising flat across four of the years and of course still spikes upward for the amazing 2005 USC offense.
The 2006 figure might be bumped up a small amount as I mentioned above due to the scoring clock rules for that season.
If you look at the breakdown in terms of points scored by USC as organized above the following conclusion pops out that I mentioned above.
The biggest problem the USC offense has had the past two years in terms of scoring has mainly been a decline in short field scoring opportunities which in reality are created as much or more by defense, special teams, and other events.
That message might seems somewhat perplexing at first but here are some additional points to keep in mind that tend to back it up overall.
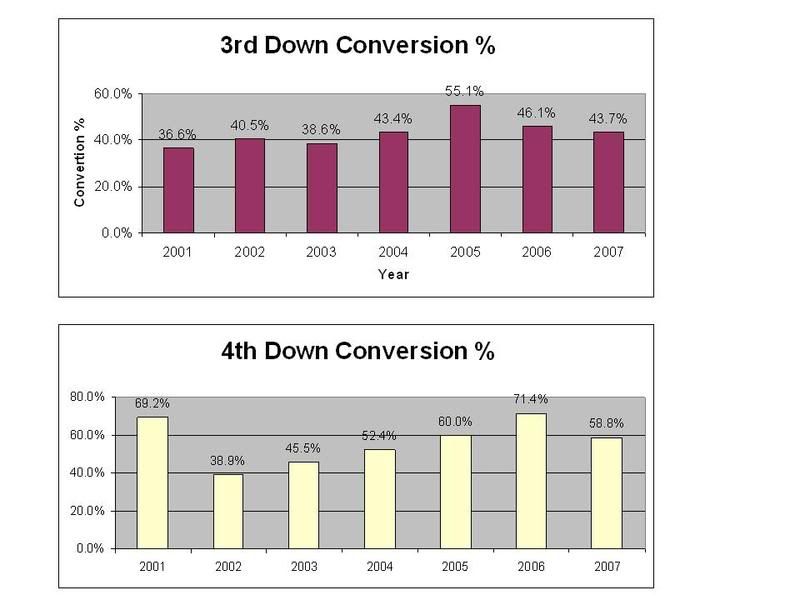
For starters third down and fourth down conversion percentages have been improving overall the past seven years for USC on offense. The 2005 squad was of course the highest but the next two best seasons have been 2006 and 2007 by a slight margin. Fourth down conversion exhibits a somewhat similar trend.
Next here is a look at the average drive length by USC the past few seasons. This figure is calculated by taking all the yards for a given season and dividing it by the total number of drives for the year.
I did not sort the data and pick out the one play kneel downs etc. before halftime or the end of the game. So this amount probably understates the "real" number by a slight margin and may affect a couple years more than others but the effect should be small (i.e. a yard or two at most).
Average yards per play over the seven year provides another insight that I think is also very revealing in terms of the total picture. USC was indeed better on offense in the years of 2003 to 2004 by about a half yard per play and of course by a larger amount in 2005 than the past two seasons.
Those years correspond directly with the development of Reggie Bush, Matt Leinart, LenDale White, the wide receiving corps and one of the best offensive lines in recent USC history. The years of 2002, 2006, and 2007 in comparison have indeed been more "ordinary" compared to those years.
In conclusion let's return to the total points situation for the USC Trojans. If fans want to see an increase in points scored per game there are of course multiple ways for the Trojans to accomplish this goal.
- For one the defense and special teams could come though again and score more some points directly. However I am not optimistic about this possibility given the past two years. 2003 in reality was probably quite unique in that regard for USC.
- Alternatively the defense also can contribute in a major way by producing the same level of turnovers accomplished in years 2001 to 2005. That would dramatically help field position and increase the probability of any given scoring drive for USC on offense (e.g. more short field opportunities).
- The more conventional angle of course is for the offense to become more explosive in terms of big play potential and increase the number of long field drives that result in scoring.
With skilled players such as Joe McKnight and Stafon Johnson at RB and many other talented receivers returning the third option indeed may be possible in 2008 for the Trojans.
However, the unknown variables at this point in time for USC on offense are of course 1) the QB position with new starter Mark Sanchez at the helm, two) the depth and talent of the 80% new offensive line, and of course three) the inevitable injuries and position shifts that will occur, etc.
With no up tick in turnovers and short field opportunities however I suspect USC will remain "stuck" around the level of 32 points per game on offense. That level is nothing to sneeze at but it feels slightly low compared to the past several seasons (a sign of how spoiled USC fans have already become?).
Keep in mind however that improving the offense is not the only thing required to win a national championship for USC or any other team for that matter.
The Florida Gators for example won the national title with a 13 Wins and one Loss mark in 2006 compiling 396 yards per game (19th in the country) and 29.7 points per game (23rd overall in scoring). That team finished strong however and had a suffocating defense at the end of the year.
In 2007 the Florida Gators improved both offensive marks to 457 yards per game to rank 14th in the country and averaged 42.4 points per game to rank third in scoring.
Despite these improvements however the Gators only finished the year with nine Wins and four Losses. Winning in football still consists of offense, defense, special teams, coaching, player talent, and other intangibles that can't always be quantified.
I'll check this trend again for USC to see how things differ in another 12 months at the end of 2008.
Other overall trends for USC and the Pac-10 are available here for those interested www.trojanfootballanalysis.com
.jpg?w=480 "Big 12 Sorsby Gambling Basketball")


.jpg?w=600 "Grading SmackDown 🔠")


