
Breaking Down the New Stat Starting to Take Baseball by Storm
The last thing baseball needs is more statistics. The game's language has been steeped in numbers since the very beginning, and we're at a point now where seemingly every baseball term has a numeric equivalent. Before long, talkin' baseball could be akin to speaking in binary.
The latest and greatest in baseball statistics, however, is a darn good one that's well worth your time. So if you haven't welcomed it yet, please do so with open arms.
We're talking, of course, about batted-ball velocity.


It also goes by exit velocity, or launch speed. Regardless, it's pretty much what it sounds like: the speed of the ball off the bat when contact is made. It's finally publicly available in 2015, and it's everywhere.
If you haven't noticed it yet...well, you actually probably have noticed it. The revolution is, after all, being televised.
If you've watched a baseball game this year, chances are you've seen a replay of a home run with a screen that looks like this:
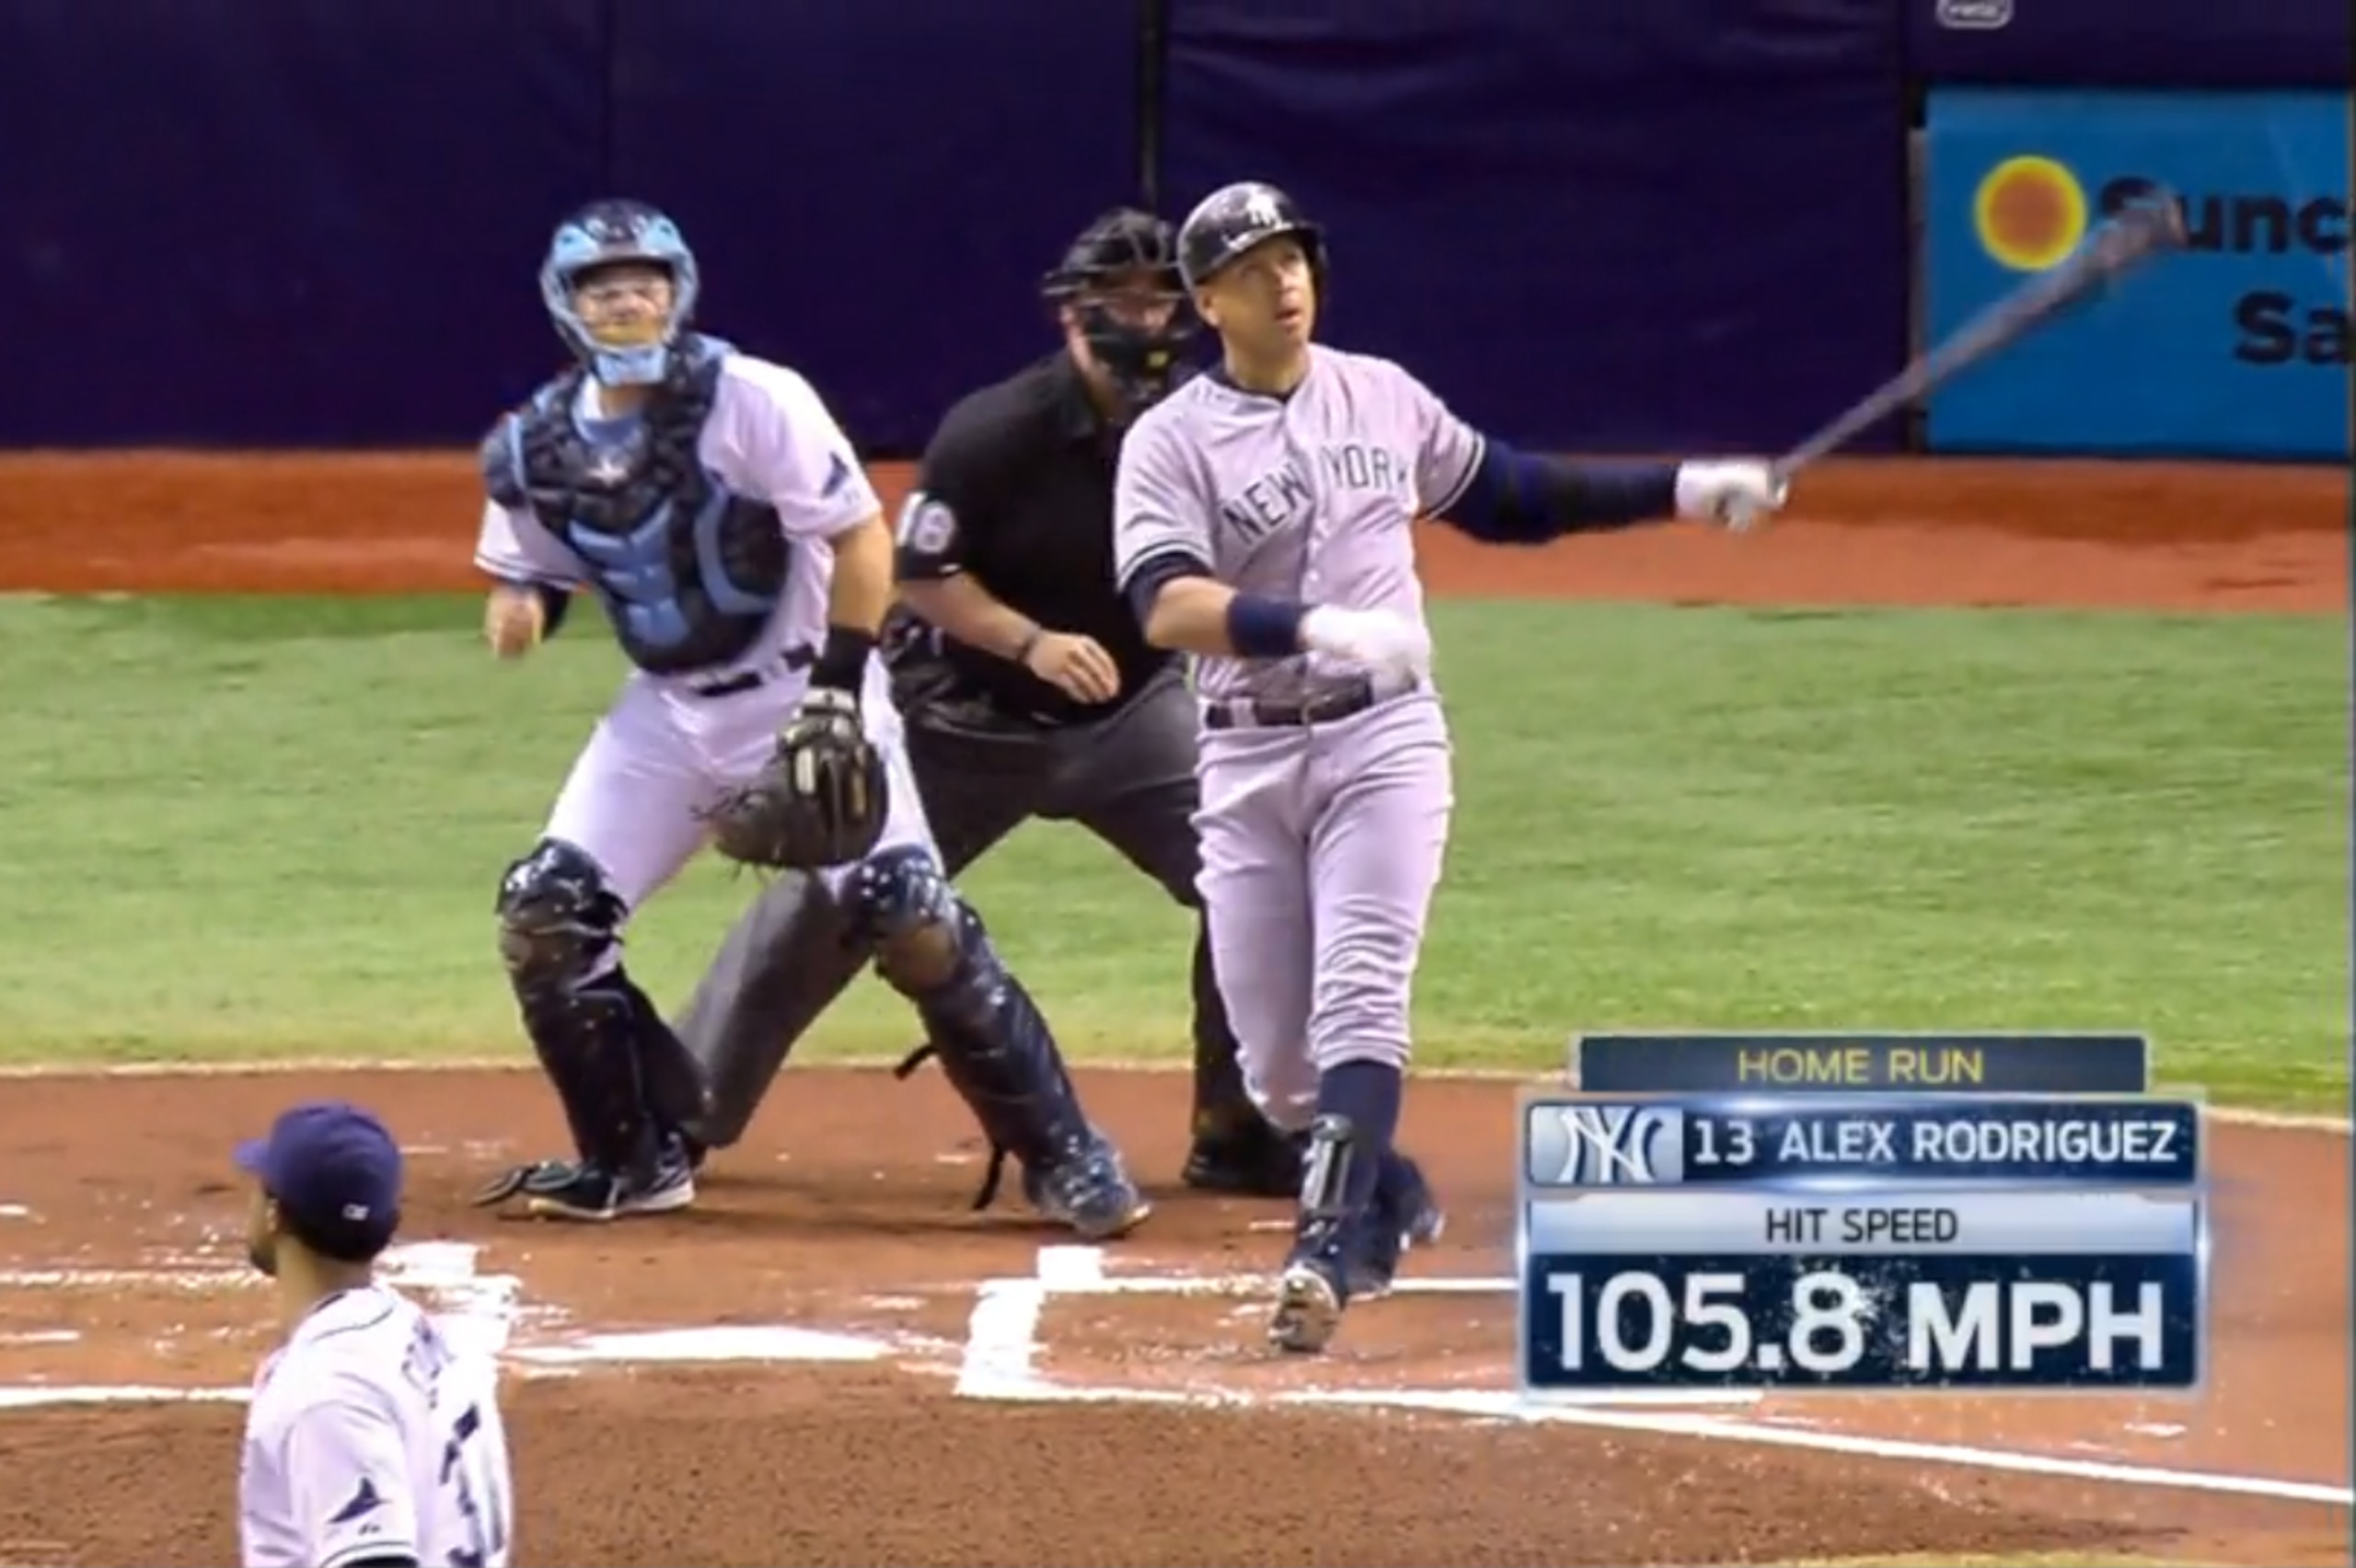
Before 2015, the home run that Alex Rodriguez hit here could have been described as "crushed" or "annihilated." Exactly how crushed or annihilated, however, would have been anyone's guess.
Not in 2015. In 2015, we know that particular home run was crushed/annihilated/whatever at exactly 105.8 miles per hour off the bat. This, surely, is what it must have been like when radar guns became en vogue and cavemen had a new way to talk about hard fastballs.
For this, you can thank Major League Baseball's new Statcast system, which is now installed at all 30 stadiums after passing a testing phase in 2014. The system uses high-resolution cameras and radar to track the action on the field, and it can measure just about anything.
For hitters, Statcast can also track batted-ball angles and distance in addition to velocity. For pitchers, it can track pitch velocity and perceived pitch velocity, as well as release points and spin rate. On defense, it can measure speed, first-step quickness and route efficiency. For examples, all you have to do is search for "Statcast" at MLB.com.
Now, though these concepts are now entering into the mainstream, understand that they're not exactly new.
By now, you've probably heard of PITCHf/x. That's a product of a company called Sportvision, and it's been the source of most of the velocity, pitch-type, pitch-movement and pitch-location data that has become increasingly popular in pitching analyses since the system's inception in 2007.
That's because, as Harry Pavlidis of Baseball Prospectus noted in 2013, Sportvision and MLB Advanced Media partnered up to make it a mandatory thing for all 30 teams back in 2008. At no point did it do that with any of Sportvision's other products, which include COMMANDf/x, FIELDf/x and HITf/x.
These products were there to offer data much like the hitting and fielding data that Statcast now offers, including batted-ball velocity. But if teams wanted it, they had to get it themselves.
In other words: They had to pay for it themselves.
"Independently, teams had to buy those products, and that’s why they’ve never really surfaced [publicly]," said Daren Willman, who runs the eternally useful BaseballSavant.com, in a phone interview. "PITCHf/x is different in that it was similar to Statcast in how they said, 'You have to have this installed.' Major League Baseball kind of enforced it. The rest of the stuff was kind of left up to the teams."
With Statcast data now readily available to everyone, these days are over. And as time goes by, it's easy to figure that all the various Statcast goodies will be gradually be accepted by the mainstream.
But batted-ball velocity has a head start. It's been the subject of a feature by Tim Rohan in the New York Times and has become a staple of baseball analysis columns at MLB.com, FanGraphs, Baseball Prospectus, Grantland, SB Nation, FiveThirtyEight.com and, yes, right here at Bleacher Report.
And understandably so. It may only be one stat, but it helps answer many questions.
If nothing else, batted-ball velocity allows for a fun new perspective on which players are the best and worst at squaring the ball up. Since it puts a number on how well batters are actually hitting the ball, it can be used to pinpoint the hardest and softest hitters in the game.
You need only go to Baseball Savant and search for the largest and the smallest average batted-ball velocities. Had you done so on Sunday, you would have gotten a top five and bottom five that looked like this:
| Giancarlo Stanton | MIA | 57 | 97.4 |
| Joc Pederson | LAD | 52 | 96.8 |
| Hanley Ramirez | BOS | 76 | 95.0 |
| Jorge Soler | CHC | 65 | 94.9 |
| Ryan Braun | MIL | 62 | 94.7 |
| Dexter Fowler | CHC | 67 | 84.6 |
| Xander Bogaerts | BOS | 66 | 84.3 |
| Jimmy Rollins | LAD | 82 | 84.2 |
| Dee Gordon | MIA | 92 | 83.1 |
| Billy Hamilton | CIN | 68 | 81.9 |
There you have it, and nothing here is overly surprising. Giancarlo Stanton is baseball's very own Hercules, so of course he's leading the way in average batted-ball velocity. On the flip side, it makes sense that a pair of wiry speed merchants like Dee Gordon and Billy Hamilton would be on the bottom.
So, that's one way to use batted-ball velocity. And maybe the purest way.
But not necessarily the most useful way. Where batted-ball velocity really comes in handy is when it's placed in the context of results. If what you really want to know is whether a hitter is getting results worthy of his contact, batted-ball velocity is your Huckleberry.
To this end, the starting point is the long-held assumption that good contact equals good results. It's a good theory, and now we have data that tells us it's a fact. Courtesy of Mr. Willman, here's a table that shows the direct correlation between good contact and good results:
| >110 | .745 | 27 |
| 105-109 | .701 | 234 |
| 100-104 | .545 | 270 |
| 95-99 | .387 | 105 |
| 90-94 | .269 | 22 |
| 85-89 | .217 | 3 |
| 80-84 | .214 | 1 |
| 75-79 | .232 | 0 |
| <75 | .229 | 0 |
With the "good contact equals good results" theory now proved by good, old-fashioned math, it can be applied as a cross-reference tool for hitters' batting averages on balls in play (BABIP).
Take Chase Utley, for instance. He entered Sunday's action with a a mere .135 BABIP, easily the worst in baseball among qualified hitters. But while that makes it look like he's having a devil of a time making good contact, his average batted-ball velocity of 87.4 miles per hour is less than cringe-worthy.
Hence Rob Arthur's article on FiveThirtyEight.com:
Short of waiting for his luck to come around, there's not much Utley can do.
That is, unless he has some way of borrowing some luck from Philadelphia Phillies teammate Freddy Galvis. Despite the fact he entered Sunday with an inferior average batted-ball velocity of 85.2 miles per hour, he also had one of the best BABIPs in MLB at .393. It looks like he has luck to spare.
This is how many pieces of baseball analysis are using batted-ball velocity, but the idea can also be turned on its head for a look at starting pitchers. You can look up how well batters are hitting the ball off them and react accordingly.
")
In general, pitchers who serve up soft contact (Chris Sale) should be embraced, while pitchers who give up loud contact (Yordano Ventura) should be shunned. And just like you can with hitters, you can cross-reference batted-ball velocity with pitchers' BABIPs and sort out the lucky and unlucky.
Mind you, none of this is to suggest that batted-ball velocity is a perfect, tell-all stat.
Jeff Sullivan of FanGraphs can highlight how the available data doesn't seem 100 percent reliable. Further, consistent hard contact is only going to help a hitter so much if he's hitting only ground balls and/or hitting the ball in an easily shiftable pattern. And while pitchers should shy away from hard contact in theory, it's not so bad if they pitch in a big home park and/or in front of a quality defense.
But in general, batted-ball velocity does provide a sort of snapshot of how well hitters and pitchers manage contact. That's something we didn't have before, as all we could really do is match up the eye test with batted-ball types (ground balls, line drives and fly balls) and directional patterns and then make our best guess. Batted-ball velocity has essentially erased the need for guesswork.
And while the data is just plain fun for the baseball hobbyist, it's more or less vital for the baseball executive.

As Rohan noted in his article in the Times, batted-ball velocity helped convince the New York Mets to cut Ike Davis loose and keep Lucas Duda in the mix last season. Davis had the track-record edge, but Duda had the edge in batted-ball velocity. As expected, that advantage has since translated into production, and it's now abundantly clear that the Mets made the right call in keeping Duda.
Simple comparisons of batted-ball velocities like that are likely to keep influencing roster decisions going forward, and teams should be able to get even more in-depth once the collection of data gets large enough to highlight certain trends.
Not unlike how changes in pitch velocity can be used, Grantland's Ben Lindbergh proposed that changes in batted-ball velocity could help highlight hitters that are losing something with age. Similarly, the data could hypothetically help distinguish a temporary slump from a possible injury or mechanical problem.
It may be a stretch to say that the possibilities for batted-ball velocity are endless, but it sure feels that way. Whether we're talking in the public sphere or in front offices, batted-ball velocity has the power to add color to a lot of areas in the analytic process that had previously been gray.
But then, you really don't need to be into baseball analytics to have an excuse to add batted-ball velocity to your baseball vocabulary. If it hasn't already yet, it will change the way you talk about the game.
Here, I can prove it. Provided you didn't just start watching baseball yesterday, you've surely experienced at least one instance where you saw a ball jump off the bat and then turned to your buddy and said, "Man, that thing came in at 95 and it must have left at 105!"
Well, now you no longer need the "must have."
Special thanks to Daren Willman for research guidance and assistance. Stats courtesy of Baseball-Reference.com and FanGraphs unless otherwise noted/linked.
If you want to talk baseball, hit me up on Twitter.


.png?w=2560 "Ranking the Best Shooters of All Time 🎯")


.jpg?w=2560 "NFL made $14.5B in revenue for 2025 season")
