
ALDS 2015: Astros vs. Royals Position-by-Position Breakdown, Predictions
A year after being the feel-good wild-card survivor in the American League, the Kansas City Royals are now trying to quash someone else’s improbable run from the play-in game to the World Series.
The Houston Astros defeated the New York Yankees on the road Tuesday to advance to the American League Division Series against the Royals, the team with the league’s best regular-season record. Game 1 is Thursday in Kansas City’s Kauffman Stadium, and this time the Royals are not anyone’s underdog despite having a losing record (2-4) against Houston this year.
Kansas City’s strengths are a balanced offensive attack—five regulars have an OPS+ higher than 120 but none higher than 128—and its outstanding defense that is one of the best in the majors and by far the best in the AL.
Its bullpen is also one of the best in the business, showing that one of last season’s most devastating units has sustained to help another pennant run, but its starters’ 4.34 ERA is the highest of all postseason rotations.
The Astros nearly missed the playoffs with 15 losses in 22 games down the stretch, which took them from four games up in the AL West to 4.5 games down last month. They bounced back to win six of their final eight to earn their playoff berth.
The Astros swept the Royals in Houston during the season, but they dropped two of three on the road, where their 33 wins were the fewest in the league. So far they are 1-0 in postseason road games, and that trend will have to continue if they are to advance past the Royals.
To determine which club has the best chance to move on to the AL Championship Series, we offer a position-by-position breakdown of both teams, including a breakdown of the starting-pitching matchups and bullpens. All statistics come courtesy of Baseball-Reference.com unless otherwise noted.
Catchers
1 of 14
Player: G BA OBP SLG HR RBI OPS OPS+ WAR
Jason Castro: 104 .211 .283 .365 11 31 .648 77 1.4
Salvador Perez: 142 .260 .280 .426 21 70 .706 89 2.2
Position Overview
Castro is a long way removed from his All-Star season in 2013, and what he provides on offense is an afterthought, as backup Hank Conger (106 OPS+) is the better offensive backstop.
However, Castro is rated among the best defensive catchers in the league, and that is where he produces most of his value. His 3.51 catcher’s ERA is the best in the league for those who have played at least 100 games, according to ESPN.com.
Perez is coming off his worst overall offensive season since he’s been in the big leagues, but his 21 home runs are a career high.
On the other side of the ball, the downward trends continue as his five defensive runs saved are his fewest since his rookie year, when he caught only 338.2 innings, according to FanGraphs data. Perez also rates 38th among major league catchers at getting his pitchers extra strikes, according to Baseball Prospectus.
The power has at least been there. His homer total is second-highest on the team.
Edge: Push
Castro has proved to be the better defensive catcher even though Perez has the higher defensive WAR—WAR is a cumulative stat, and Perez has played more than 300 full innings more than Castro this season. However, Perez is a bit better with the bat, particularly in the power department, offsetting Castro’s defensive advantage enough to call this even.
1st Basemen
2 of 14
Player: G BA OBP SLG HR RBI OPS OPS+ WAR
Chris Carter: 129 .199 .307 .427 24 64 .734 100 -0.1
Eric Hosmer: 158 .297 .363 .459 .822 18 93 .822 122 3.6
Position Overview
All of Carter’s value comes through his power, and he hit two home runs in 16 plate appearances against the Royals this season. Those were also his only two hits against them.
Carter drew three walks Tuesday against the New York Yankees, and if he can show that kind of hitting eye and patience in the ALDS, he could be an offensive factor at some point in the series.
It is easily arguable that 2015 was Hosmer’s best season in his five-year career, and his career highs in OPS and OPS+ are some of the evidence. In his age-25 season, he is still in the second tier of offensive first basemen, but his 125 wRC+ by FanGraphs’ calculations shows he is climbing the ladder.
Last year’s postseason was Hosmer’s showcase. He batted .351/.439/.526 with a .966 OPS and five extra-base hits in 66 plate appearances. If he can keep on producing hugely when the lights are brightest, he becomes a distinct advantage at his position in any series the Royals play.
Edge: Kansas City Royals
While Hosmer showed a strong offensive prowess during the regular season, last year’s postseason numbers prove he can set himself apart on the biggest stage. Any repeat of that performance gives him a massive edge.
2nd Basemen
3 of 14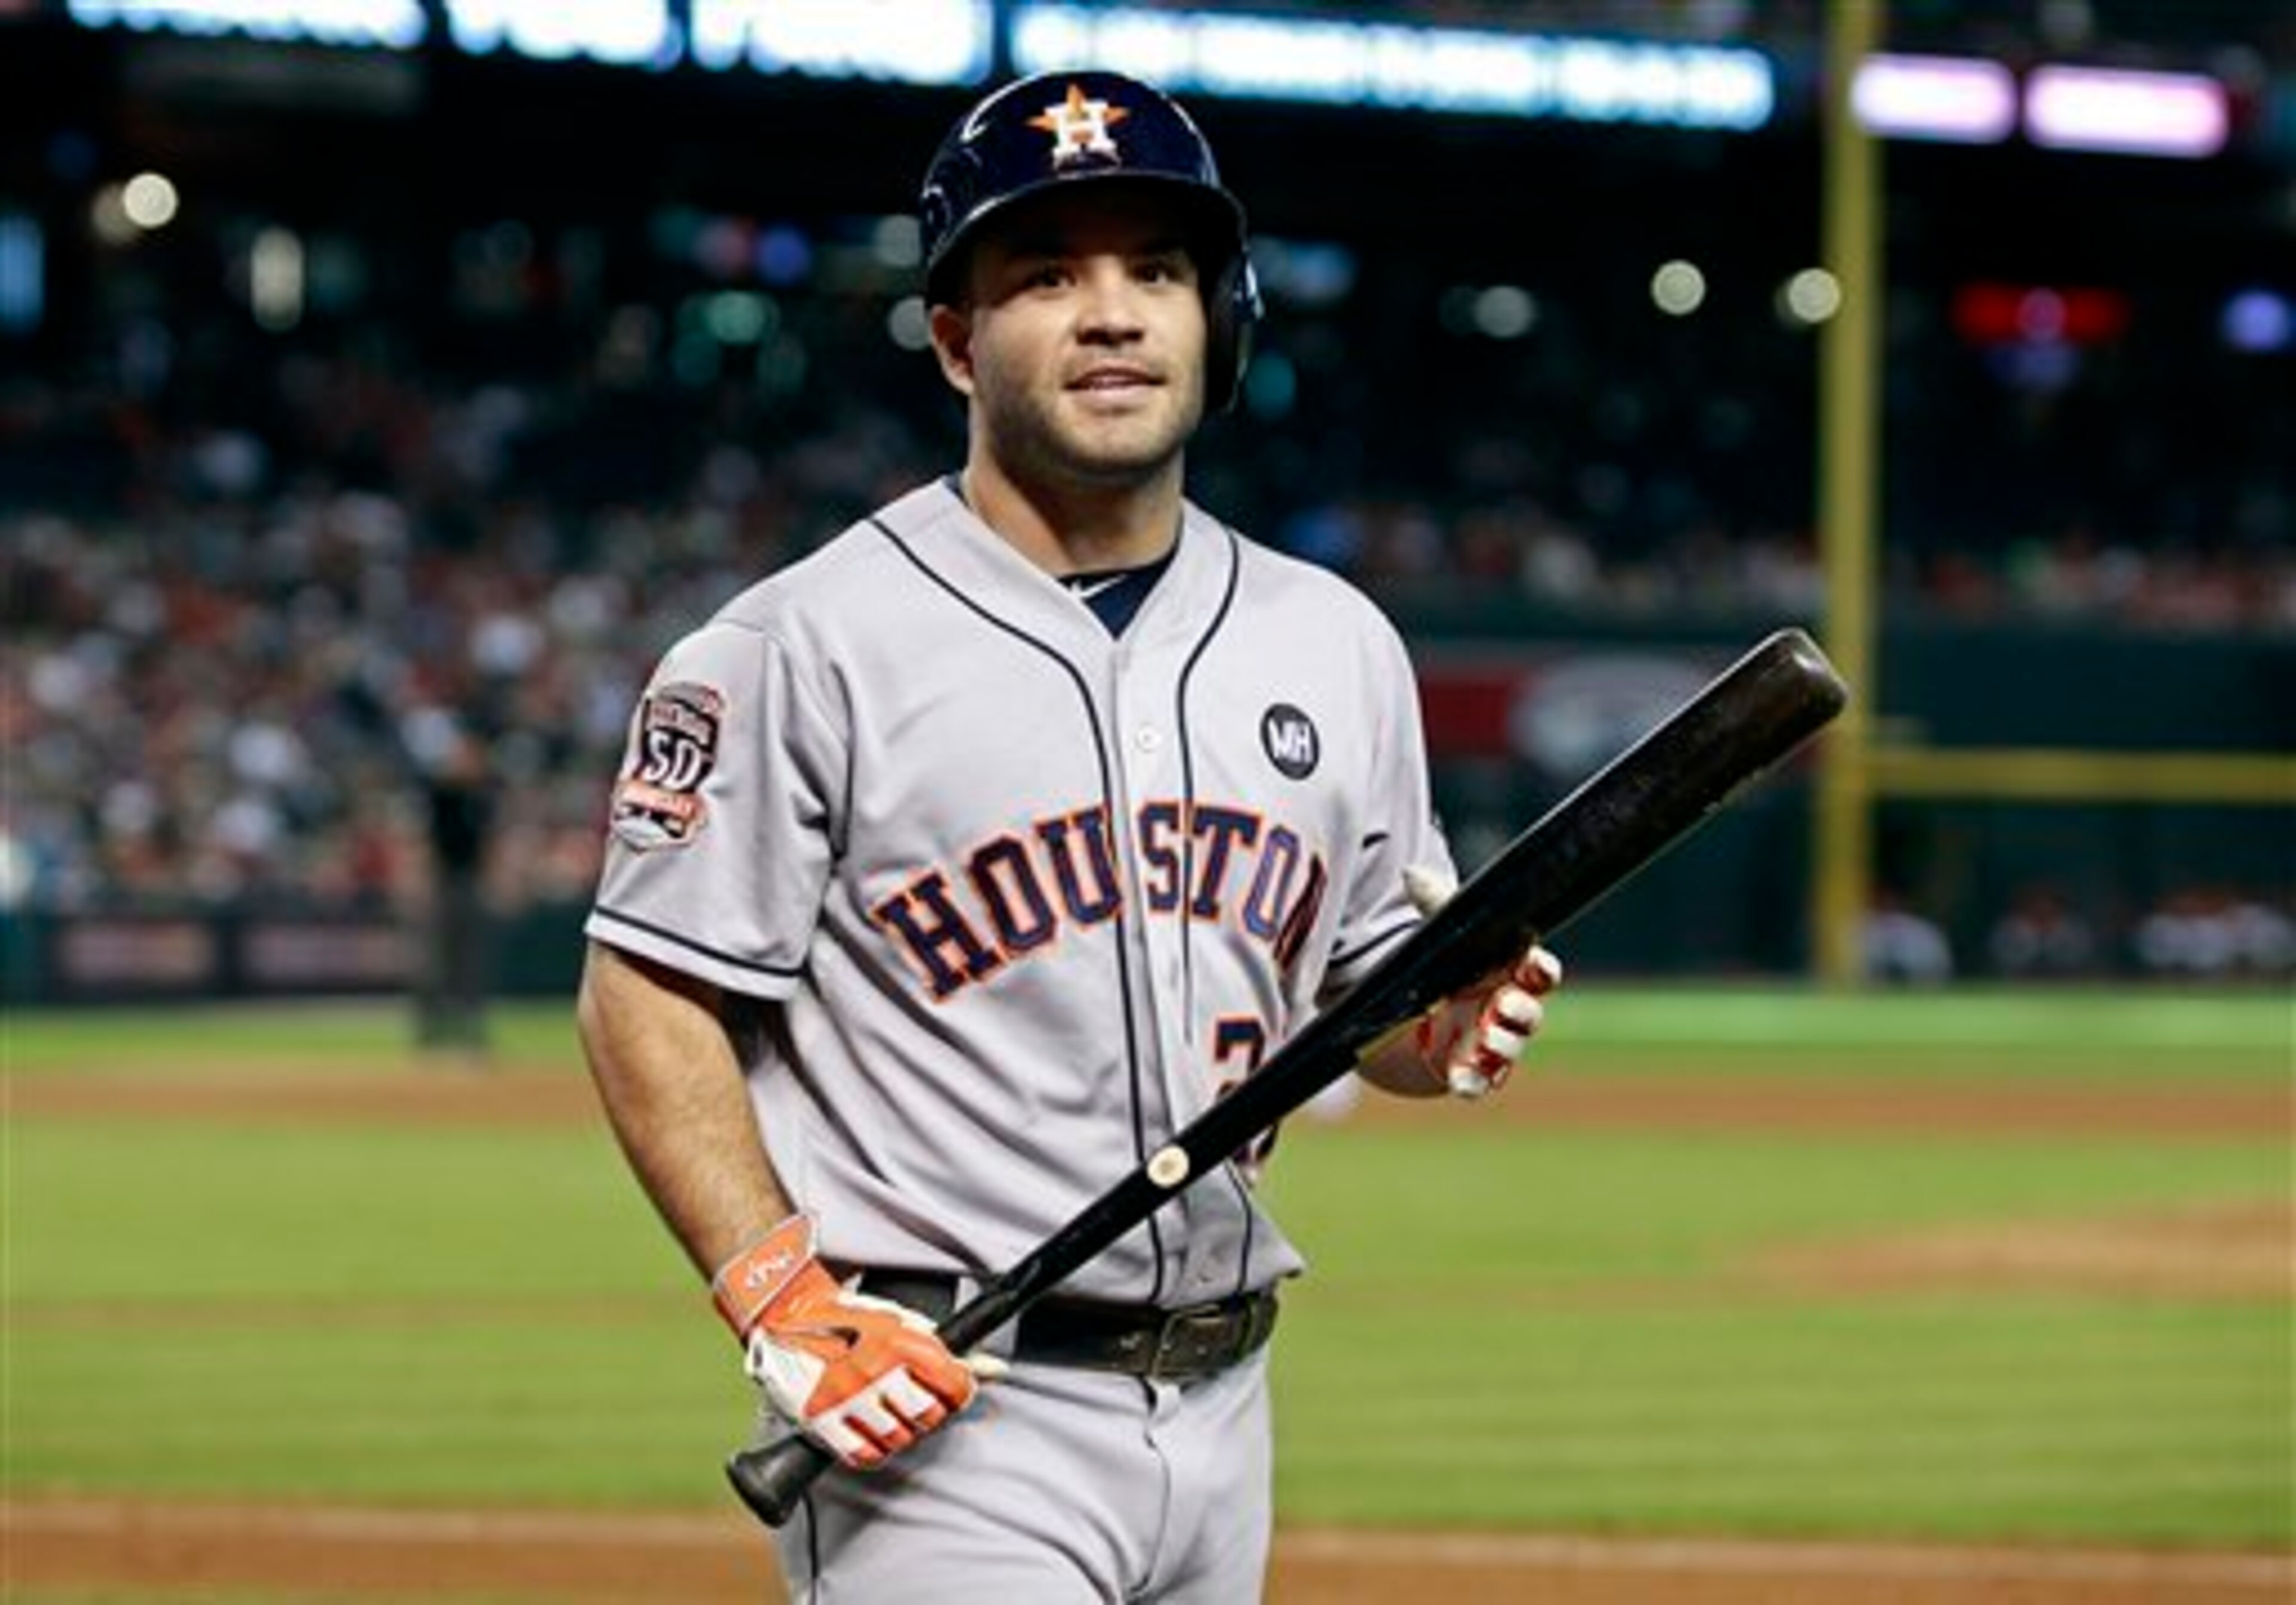
Player: G BA OBP SLG HR RBI OPS OPS+ WAR
Jose Altuve: 154 .313 .353 .459 15 66 .812 122 4.5
Ben Zobrist: 126 .276 .359 .450 13 56 .809 120 1.2
Position Overview
Altuve is among the best second basemen in the league, and he led it in hits (200) and steals (38) for the second consecutive year. He also had a hit and an RBI in the Wild Card Game on Tuesday.
Altuve hit well against the Royals this season, slashing .333/.385/.500 with an .885 OPS in 26 plate appearances in the six games the teams played. He has also been among the league’s best hitters in the second half, posting a .337/.372/.512 slash line with seven of his 15 home runs coming in a dozen fewer games than the first half. His 2.8 FanGraphs WAR since the All-Star break ranks in the league’s top 10.
Zobrist went to the Royals in a trade before the July trade deadline, and after bouncing around the diamond while the team was dealing with injuries, he eventually took over as the everyday second baseman for Omar Infante once September started. That has been a good move, as Infante put up a ridiculously awful 49 OPS+, especially when compared against Zobrist’s 121 OPS+ with Kansas City.
However, in 21 postseason games (73 plate appearances) since 2008, Zobrist has struggled with a .212/.288/.333 slash line. While there is no doubt he is an upgrade from Infante at the position, if he does not change that playoff trend, he could end up hurting the Royals.
Edge: Houston Astros
Altuve’s second-half production and power potential set him apart from Zobrist, and his ability to potentially alter the series with his running game gives him yet another dynamic. In his first postseason, Altuve could show the baseball world exactly how good he has been the last two seasons.


Shortstops
4 of 14
Player: G BA OBP SLG HR RBI OPS OPS+ WAR
Carlos Correa: 99 .279 .345 .512 22 68 .857 132 4.1
Alcides Escobar: 148 .257 .293 .320 3 47 .614 68 0.6
Position Overview
Correa, the No. 1 overall draft pick in 2012, became a four-win player in fewer than 100 games because of his power and on-base skills. And while his defense is still a work in progress, he has the range and arm to make spectacular highlight-reel plays.
Called up as a 20-year-old, Correa, now 21, got off to a hot start with five home runs and seven doubles in his first 19 games. That power is something that never cooled, as he has not hit fewer than five home runs in any of the four calendar months he played with the Astros.
On the other side, hardly any of Escobar’s value comes at the plate, which is somewhat acceptable for a shortstop. That is a good for the Royals since 2015 was among Escobar’s worst at the plate.
The problem is Escobar is not an elite defender like he once projected to be as a prospect and early in his major league career. His minus-one defensive runs saved does not look good, but his 13.9 overall defensive rating by FanGraphs is still puts him among the better defensive shortstops in the league, which lacks a true elite defender at the position.
Edge: Houston Astros
Correa’s defense is his weak spot for now, but in a short series he can shine with the glove. And if he gets hot for about a week, he can completely change the outlook of the ALDS by putting on a power display few 21-year-olds in the world are capable of showcasing.
3rd Basemen
5 of 14
Player: G BA OBP SLG HR RBI OPS OPS+ WAR
Luis Valbuena: 132 .224 .310 .438 25 56 .748 103 2.1
Mike Moustakas: 147 .284 .348 .470 22 82 .817 120 4.4
Position Overview
Valbuena has been relatively average because he lacks the on-base prowess to become more valuable. However, his power is an undeniable asset, and his 25 homers this year were a career high.
And although he went just 1-for-4 in the Wild Card Game, he enters the postseason red-hot over his last 10 regular-season games—.526 average (10-for-19), 1.801 OPS, three home runs—and nearly as hot over his last 19—.357 average (15-for-42), .449 OBP, 1.116 OPS.
Once the second overall pick in the draft, Moustakas was supposed to be great by now in his age-27 season. He has mostly disappointed on offense, but this was his breakout year as he set career highs in homers, RBI, walks, average, OBP, slugging, OPS and OPS+. His 4.4 WAR was also by far the best mark of his career.
Moustakas was not great in last year’s postseason, but his five home runs in 15 games made him an offensive factor throughout October. If he can produce that kind of power again, or the kind he gave the Royals during this regular season or both, he could end up being one of the more productive players at his position in these playoffs.
Edge: Kansas City Royals
Moustakas has been the better statistical player all season and is a good defensive third baseman. And if he can show the kind of pop he did last postseason, he will offset whatever power Valbuena might bring.
Left Fielders
6 of 14
Player: G BA OBP SLG HR RBI OPS OPS+ WAR
Colby Rasmus: 137 .238 .314 .475 25 61 .789 113 2.6
Alex Gordon: 104 .271 .377 .432 13 48 .809 120 2.8
Position Overview
Rasmus signed a one-year, $8 million deal with the Astros in hopes of resurrecting his career and reputation and eventually garnering a bigger multiyear contract over this coming offseason. The plan worked to an extent, as Rasmus had a better season than he did in 2014, but aside from his 25 homers and 154 strikeouts, most of his numbers did not stand out.
However, over his last 21 regular-season games, Rasmus’ numbers ticked up. He hit .299/.405/.642 with a 1.047 OPS and seven home runs in 80 plate appearances. He homered again in the wild-card win against the New York Yankees.
Gordon had an absolutely outstanding 2014 season, and he was on his way to having another in a contract year this season. But a groin injury kept him out of the lineup for nearly two months. He came back to play all of September and had a .328 BABIP, and as always, he is a defensive wizard in left field.
Gordon did not do much in last year’s postseason, hitting .204, but he did manage six doubles during Kansas City's run.
Edge: Push
Rasmus’ hot finish to the regular season and his pummeling of a Masahiro Tanaka mistake Tuesday have boosted his value to the Astros lineup. Gordon, meanwhile, also had a hot start to the year, and his elite defense could have as big an impact in the series as Rasmus’ power potential.
Center Fielders
7 of 14
Player: G BA OBP SLG HR RBI OPS OPS+ WAR
Carlos Gomez: 115 .255 .314 .409 12 56 .724 97 0.7
Lorenzo Cain: 140 .307 .361 .477 16 72 .838 126 7.2
Position Overview
Gomez’s season took what we thought was a turn to the east in July when the Milwaukee Brewers agreed to trade him to the New York Mets before the non-waiver deadline in July. The deal collapsed, though, and Gomez ended up heading south to Houston.
An intercostal injury cost him two weeks in September. But his numbers with the Astros were down before that, and he ended up hitting .242/.288/.383 in 41 games with the team. Gomez can be a streaky hitter, though, and he can get hot without notice as he showed with a solo home run in Tuesday’s wild-card win.
Gomez is also a strong defender with good speed, and both those assets can impact the series if he’s given the chances.
Cain has propelled himself into the game’s upper echelon of players, and his 7.2 WAR was fourth-highest among American League position players. He has also remained one of the best overall defensive outfielders in the league.
Cain will probably never wow anyone with his sheer offensive force, but his all-around game is among the best in the majors, something he proved during last season’s playoffs. He hit .333/.388/.417, and as the No. 3 hitter batting in front of Eric Hosmer and Kendrys Morales, that’s all he needs to do to have a significant impact this postseason.
Edge: Kansas City Royals
Cain has turned himself into one of the best players in the American League, and while Gomez can be a productive player, he is not on the same level as his Royals counterpart.
Right Fielders
8 of 14
Player: G BA OBP SLG HR RBI OPS OPS+ WAR
George Springer: 102 .276 .367 .459 16 41 .826 126 3.8
Alex Rios: 105 .255 .287 .353 4 32 .640 73
Position Overview
Springer missed two months in July and August with a fractured wrist, but he was strong in the 27 games he played to close out the regular season. He produced a .304/.373/.464 slash line and a .352 BABIP.
Springer is a former center fielder who can cover a lot of ground as a corner man. He also has the kind of power that can make him a force around the top of Houston lineup, as he has 36 homers in 796 career plate appearances.
Rios was a bit of a disappointment this season because of a hand injury and his lack of production. But the fact Rios has waited for this stage his entire 12-year career could make him dangerous as an unknown October commodity.
The 34-year-old has played 1,691 games in his major league career without appearing in a playoff game, and that he has produced a .307/.325/.474 slash line with a .363 BABIP in his last 31 games shows he is still capable of being a productive hitter.
Edge: Houston Astros
Both players have been productive since returning from injuries, but Springer’s potential to be a good corner outfielder and hit for power give him the nod.
Designated Hitters
9 of 14
Player: G BA OBP SLG HR RBI OPS OPS+ WAR
Evan Gattis: 153 .246 .285 .463 27 88 .748 101 0.5
Kendrys Morales: 158 .290 .362 .485 22 106 .847 128 2.4
Position Overview
Gattis provides little value outside of his power, but he did manage a respectable .329 OBP in his last 22 games to end the regular season.
When the Royals gave Morales $17 million over two seasons, it was a questionable deal considering he was coming off a season in which he played just 98 games and put up a 75 OPS+. But he has turned out to be the team’s best run producer in his first year with the Royals.
With Lorenzo Cain and Eric Hosmer as strong on-base guys in front of him, Morales had his first 100-RBI season since 2009, when he finished fifth in the American League MVP voting as a Los Angeles Angel. If both those guys continue getting on base in the postseason, Morales could end up with big numbers for the rest of the month.
Edge: Kansas City Royals
Morales gives the Royals much more from the DH spot in terms of getting on base and driving in runs. He is the better all-around hitter and is capable of just as much power as Gattis.
Game 1 Starters
10 of 14
Player: GS W-L IP ERA FIP WHIP BB K WAR
Collin McHugh: 32 19-7 203.2 3.89 3.58 1.277 53 171 3.1
Yordano Ventura: 28 13-8 163.1 4.08 3.57 1.298 58 156 1.9
Position Overview
A season after finishing fourth in Rookie of the Year voting, McHugh won 19 games and threw more than 200 innings, putting him in the conversation of very good starting pitchers in the AL. As a reward, he gets the ball in Game 1 of the ALDS.
Despite having a spotty September, McHugh still managed to produce a 2.89 ERA in his final 11 starts this season, going 7-2.
Ventura’s season has been cut into two distinct halves, and the first was quite ugly for a pitcher expected to be the team’s No. 1 starter when the season started. In his first 14 turns, Ventura had a 5.19 ERA and had four starts when he did not pitch beyond the fourth inning, causing the Royals to demote him to the minors in July.
However, before Ventura even left town, Jason Vargas suffered a season-ending injury, and Ventura was recalled. Since then, he is 9-1 with a 3.10 ERA, and the team is 11-3 in his starts.
Edge: Push
Both starters have been very good down the stretch, but neither has the credentials to be wildly above the other.
Game 2 Starters
11 of 14
Player: GS W-L IP ERA FIP WHIP BB K WAR
TBD
Johnny Cueto: 32 11-13 212 3.44 3.53 1.132 46 176 3.9
Position Overview
Cueto spent the first part of his year with the Cincinnati Reds, putting up a 2.62 ERA and becoming one of the most coveted trade targets in July. The Royals pulled off the deal to get him, and his first four starts were wonderful—1.80 ERA in 30 innings.
Things changed quickly after that. In Cueto’s next nine turns, he went 2-6 with a 6.49 ERA and allowed nine home runs. The team was 2-7 in those outings, and it likely cost Cueto the Game 1 start in this series.
Edge: TBD
Game 3 Starters
12 of 14
Player: GS W-L IP ERA FIP WHIP BB K WAR
TBD
Edinson Volquez: 33 13-9 200.1 3.55 3.82 1.308 72 155 2.5
Position Overview
The Astros have not announced a starter for this game, but it lines up for Dallas Keuchel, who pitched six shutout innings on short rest in Tuesday’s Wild Card Game.
Volquez looked like he would pick up the slack left by Yordano Ventura early in the season. He had a 3.18 ERA through his first 15 turns through the rotation and had eight quality starts.
He has flashed inconsistency since then, but even still, his ERA was a reasonable 3.93 in his final 18 starts. Hitters did have a .326 BABIP against him in those outings as opposed to .257 in the first 15.
Edge: TBD (for now)
If Keuchel gets the ball in this game, the advantage clearly goes to him and the Astros.
Bullpens
13 of 14
Wade Davis (0.94 ERA, 0.787 WHIP, 10.4 K/9, 17 saves) CL Luke Gregerson (3.10 ERA, 0.951 WHIP, 8.7 K/9, 31 saves)
Kelvin Herrera (2.71 ERA, 1.120 WHIP, 8.3 K/9, 21 holds) SU Will Harris (1.90 ERA, 0.901 WHIP, 8.6 K/9, 13 holds)
Ryan Madson (2.13 ERA, 0.963 WHIP, 8.2 K/9, 20 holds) SU Tony Sipp (1.99 ERA, 1.031 WHIP, 10.3 K/9, 13 holds)
Position Overview
The Astros’ bullpen was one of the great ones in the AL this season. Its 3.27 ERA was fourth. Its 3.38 FIP was second. Its 9.11 strikeouts per nine innings were second, as was its 3.43 strikeout-to-walk ratio.
Also, its 1.11 WHIP was the best in the league, and it also checked in as the 17th lowest for any bullpen in the Live Ball Era, which started in 1920, according to FanGraphs.
Gregerson did not have the dominant ERA, but his WHIP was seventh-lowest, as was his xFIP. Harris’ WHIP was third-lowest in the league, and he and Sipp had the sixth- and fifth-highest strand rates, respectively, according to FanGraphs.
The problem: Houston’s bullpen struggled in the final weeks of the regular season with a 5.63 ERA in September and October, the worst in the majors in that time.
The Royals’ relievers were the strength of last year’s club that went to the seventh game of the World Series, and this year’s group could be just as good even without last year’s closer, Greg Holland, who was lost for the season with a UCL tear after posting a 5.82 ERA in his final 19 appearances this year.
Davis took over as closer after Holland’s injury and allowed one earned run in his final 19.2 innings. He also struck out 25, and opponents hit .098 against him in that time. Also, in last year’s postseason, Davis gave up one earned run in 14.1 innings (0.63 ERA) and struck out 20. Those are the kinds of numbers that make his dominance unquestioned.
Last season’s seventh-inning guy, Herrera, moved into the eighth-inning role after Holland’s injury, and while he has had his struggles this season—his ERA, FIP, home runs per nine innings, strikeouts per nine and strikeout-to-walk ratio are all worse this year than they were last year—he has still been a reliable setup man.
Coupling him with newcomer Madson, who is in his first season in the majors since 2011, the Royals again have a strong one-two punch before handing the ball to their closer, and last season that formula nearly helped them win a World Series.
Edge: Kansas City Royals
Both groups have strong performers at the back end, but Davis is the best in either bullpen. That along with the Astros’ late-season struggles make the Royals the stronger unit entering this series.
Series Predictions
14 of 14
Game 1: Kansas City Royals 4, Houston Astros 2
Yordano Ventura struggles with his command but manages to limit the damage until manager Ned Yost pulls him in the sixth inning and hands his dominant bullpen a lead it does not relinquish. McHugh pitches well, but a three-run home run by Alex Gordon does him in.
Game 2: Houston Astros 6, Kansas City Royals 2
Johnny Cueto’s late-season struggles continue, and he allows two home runs in five innings as the Astros even the series.
Game 3: Houston Astros 3, Kansas City Royals 1
Houston ace Dallas Keuchel comes back on normal rest after his wild-card gem and shuts down the Royals over seven-plus innings.
Game 4: Houston Astros 7, Kansas City Royals 4
Ventura is not as fortunate coming back on short rest, and the rotation that was the weakest spot of the Royals club hurts it in its final game. The Astros use a rested bullpen to hold the lead and get big offensive contributions from Jose Altuve and Carlos Correa, both of whom homer.


.jpg?w=3840 "AEW Dynamite Live Grades 🔠")
