

Will Rangers' Rick Nash Rediscover Scoring Touch Before It's Too Late?
When New York Rangers general manager Glen Sather traded a rich assortment of NHL assets (two good players, one excellent prospect and a high draft pick) to Columbus to add Rick Nash, he might well have pictured Nash as the missing piece of a contending Rangers team.
As it turns out, the Rangers are a contending team, but Nash has appeared to be anything but a crucial piece of the puzzle.
With just three markers in 21 postseason games, his vaunted goal scoring touch has abandoned him. With only 10 points, he’s been lapped in total production by members of the supporting cast.
-(1).jpg?w=2560 "Bleacher Report")
.jpg?w=2560 "Simon Edvisson Landing Spots")
What has happened to him in these playoffs? Is it fixable?
Before we get into his point production, we need to put the situation into context. Points matter, and for the most part they do a nice job of demonstrating both offensive and defensive effectiveness—the best way not to be scored on is by playing in the opposition's zone, and except with really terrible finishers, points are generally a byproduct of that.
As Nash himself noted to Newsday’s Arthur Staple earlier in the week, points are only part of the equation:
"I think I always have pressure on myself to produce, but at the end of the day, we want to win games. We don't really care about personal statistics. If that's scoring a goal, great. If that's blocking a shot or killing a penalty, you do that, too.
"
We can create that context by looking at the other things that happen when a player is on the ice.
Does his team generate more shots and goals than the opposition? Where are his shifts starting? Who does he play against?
The following numbers for New York’s seven regular wingers—the Rangers dress five centres, with one of them occasionally spending time on the wing—make Nash’s value abundantly clear:
| Benoit Pouliot | 53.5 | 65.2 | 60.6 | 6 |
| Rick Nash | 52.7 | 52.9 | 54.5 | 2 |
| Mats Zuccarello | 50.6 | 60.7 | 55.6 | 5 |
| Chris Kreider | 49.4 | 45.5 | 49.4 | 1 |
| Derek Dorsett | 49.3 | 28.6 | 30.4 | 7 |
| Martin St. Louis | 48.4 | 60 | 60 | 3 |
| Carl Hagelin | 43.9 | 61.1 | 57.3 | 4 |
That’s a wall of numbers to some degree, but we can distill its meaning for Nash thusly:
- The Rangers generate more shot attempts than the opposition with Rick Nash on the ice. Nash ranks second among New York wingers in this category. Not shown on this chart is the percentage of shots taken by his team when he's on the ice. Nash leads all New York forwards in that category.
- The Rangers generate more goals than the opposition with Rick Nash on the ice. Goals generally follow shot attempts—with a certain degree of fluctuation owing to finishing/goaltending—but over 20 or so games, they can diverge. In this case, Nash’s line outscores the opposition.
- The Rangers have had this success with Nash on the ice despite the fact that he regularly plays the opposition’s top line and his line starts a greater percentage of its shifts in the defensive zone than either the Rangers’ second or third lines.
From context, that sounds like a pretty good player. That sounds like the Rick Nash that New York traded for.

It’s important to keep that context in mind, because while Nash has had his problems, good things have generally happened with him on the ice. Unlike with some of the other lines, those good things are a result of outshooting the opposition rather than having the good fortune of seeing pucks go into the net.
But while Nash’s line is doing good things, Nash himself isn’t collecting points. Why is that?
First, let’s establish how he’s done compared to his career to date. We’ll make the comparison by boiling down Nash’s entire regular-season career to an average 82-game segment and projecting his playoff work in 2013-14 over 82 contests.
This is what that looks like:
| Nash, NHL career | 82 | 35 | 31 | 66 |
| Nash, 2013-14 playoffs | 82 | 12 | 27 | 39 |
| Difference | -65.7% | -12.9% | -40.9% |
Assist-wise, Nash is almost right on the money. Using his career numbers, we’d expect Nash to have eight assists over an average 21-game segment. In these playoffs, he has seven.
That’s an insignificant discrepancy—one puck going in, one extra player making a pass and bumping Nash from a secondary assist (recorded) to a tertiary one (not recorded).
The real problem is goals. Nash is scoring at one-third of the clip we would expect him to score at based on his career totals. What’s driving that? Let’s look at our imaginary 82-game season again:
| Player | GP | Goals | Shots | SH% |
| Nash, NHL career | 82 | 35 | 284 | 12.4 |
| Nash, 2013-14 playoffs | 82 | 12 | 265 | 4.1 |
| Difference | -65.7% | -6.7% | -66.9% |
We see that Nash’s shot totals are down by an almost imperceptible amount. Meanwhile, his shooting percentage has fallen off the face of the earth.
It’s a massive drop. For the sake of perspective, 197 NHL forwards have managed to accumulate at least 500 shots over the last five seasons. Of that group, a 12.4 shooting percentage would rank 47th (tied with Marian Hossa and Ilya Kovalchuk). The group ends at No. 197 with Shawn Thornton’s 4.5 percent number.
In other words, it's the difference between Hossa shooting the puck and somebody with less finishing ability than Thornton shooting the puck.
While that sounds pretty bad, The Globe and Mail’s James Mirtle notes that Nash isn’t the first star forward to see his goal totals disappear in the playoffs:
"Take Jonathan Toews as one example. He’s being (rightly) hailed as a repeat Conn Smythe candidate for his performance in these playoffs, but we really aren’t all that far removed from talking about his own goal drought… Going back to the 2010 playoffs when he won his first Cup, Toews at one point had only four goals in a 41-game stretch in the postseason, something he managed despite playing on better teams and with better linemates.
"
Toews managed to get on track, and the really good news for New York is that Nash appears to be figuring things out, too.
Nash went 14 games without a goal in these playoffs, but he scored in Game 1 of the Rangers’ third-round series against Montreal. Since then, he has scored three times on 16 shots, an 18.8 percent clip that’s actually better than his career number.
Nash also had a pair of pretty decent chances against Los Angeles in Game 1:
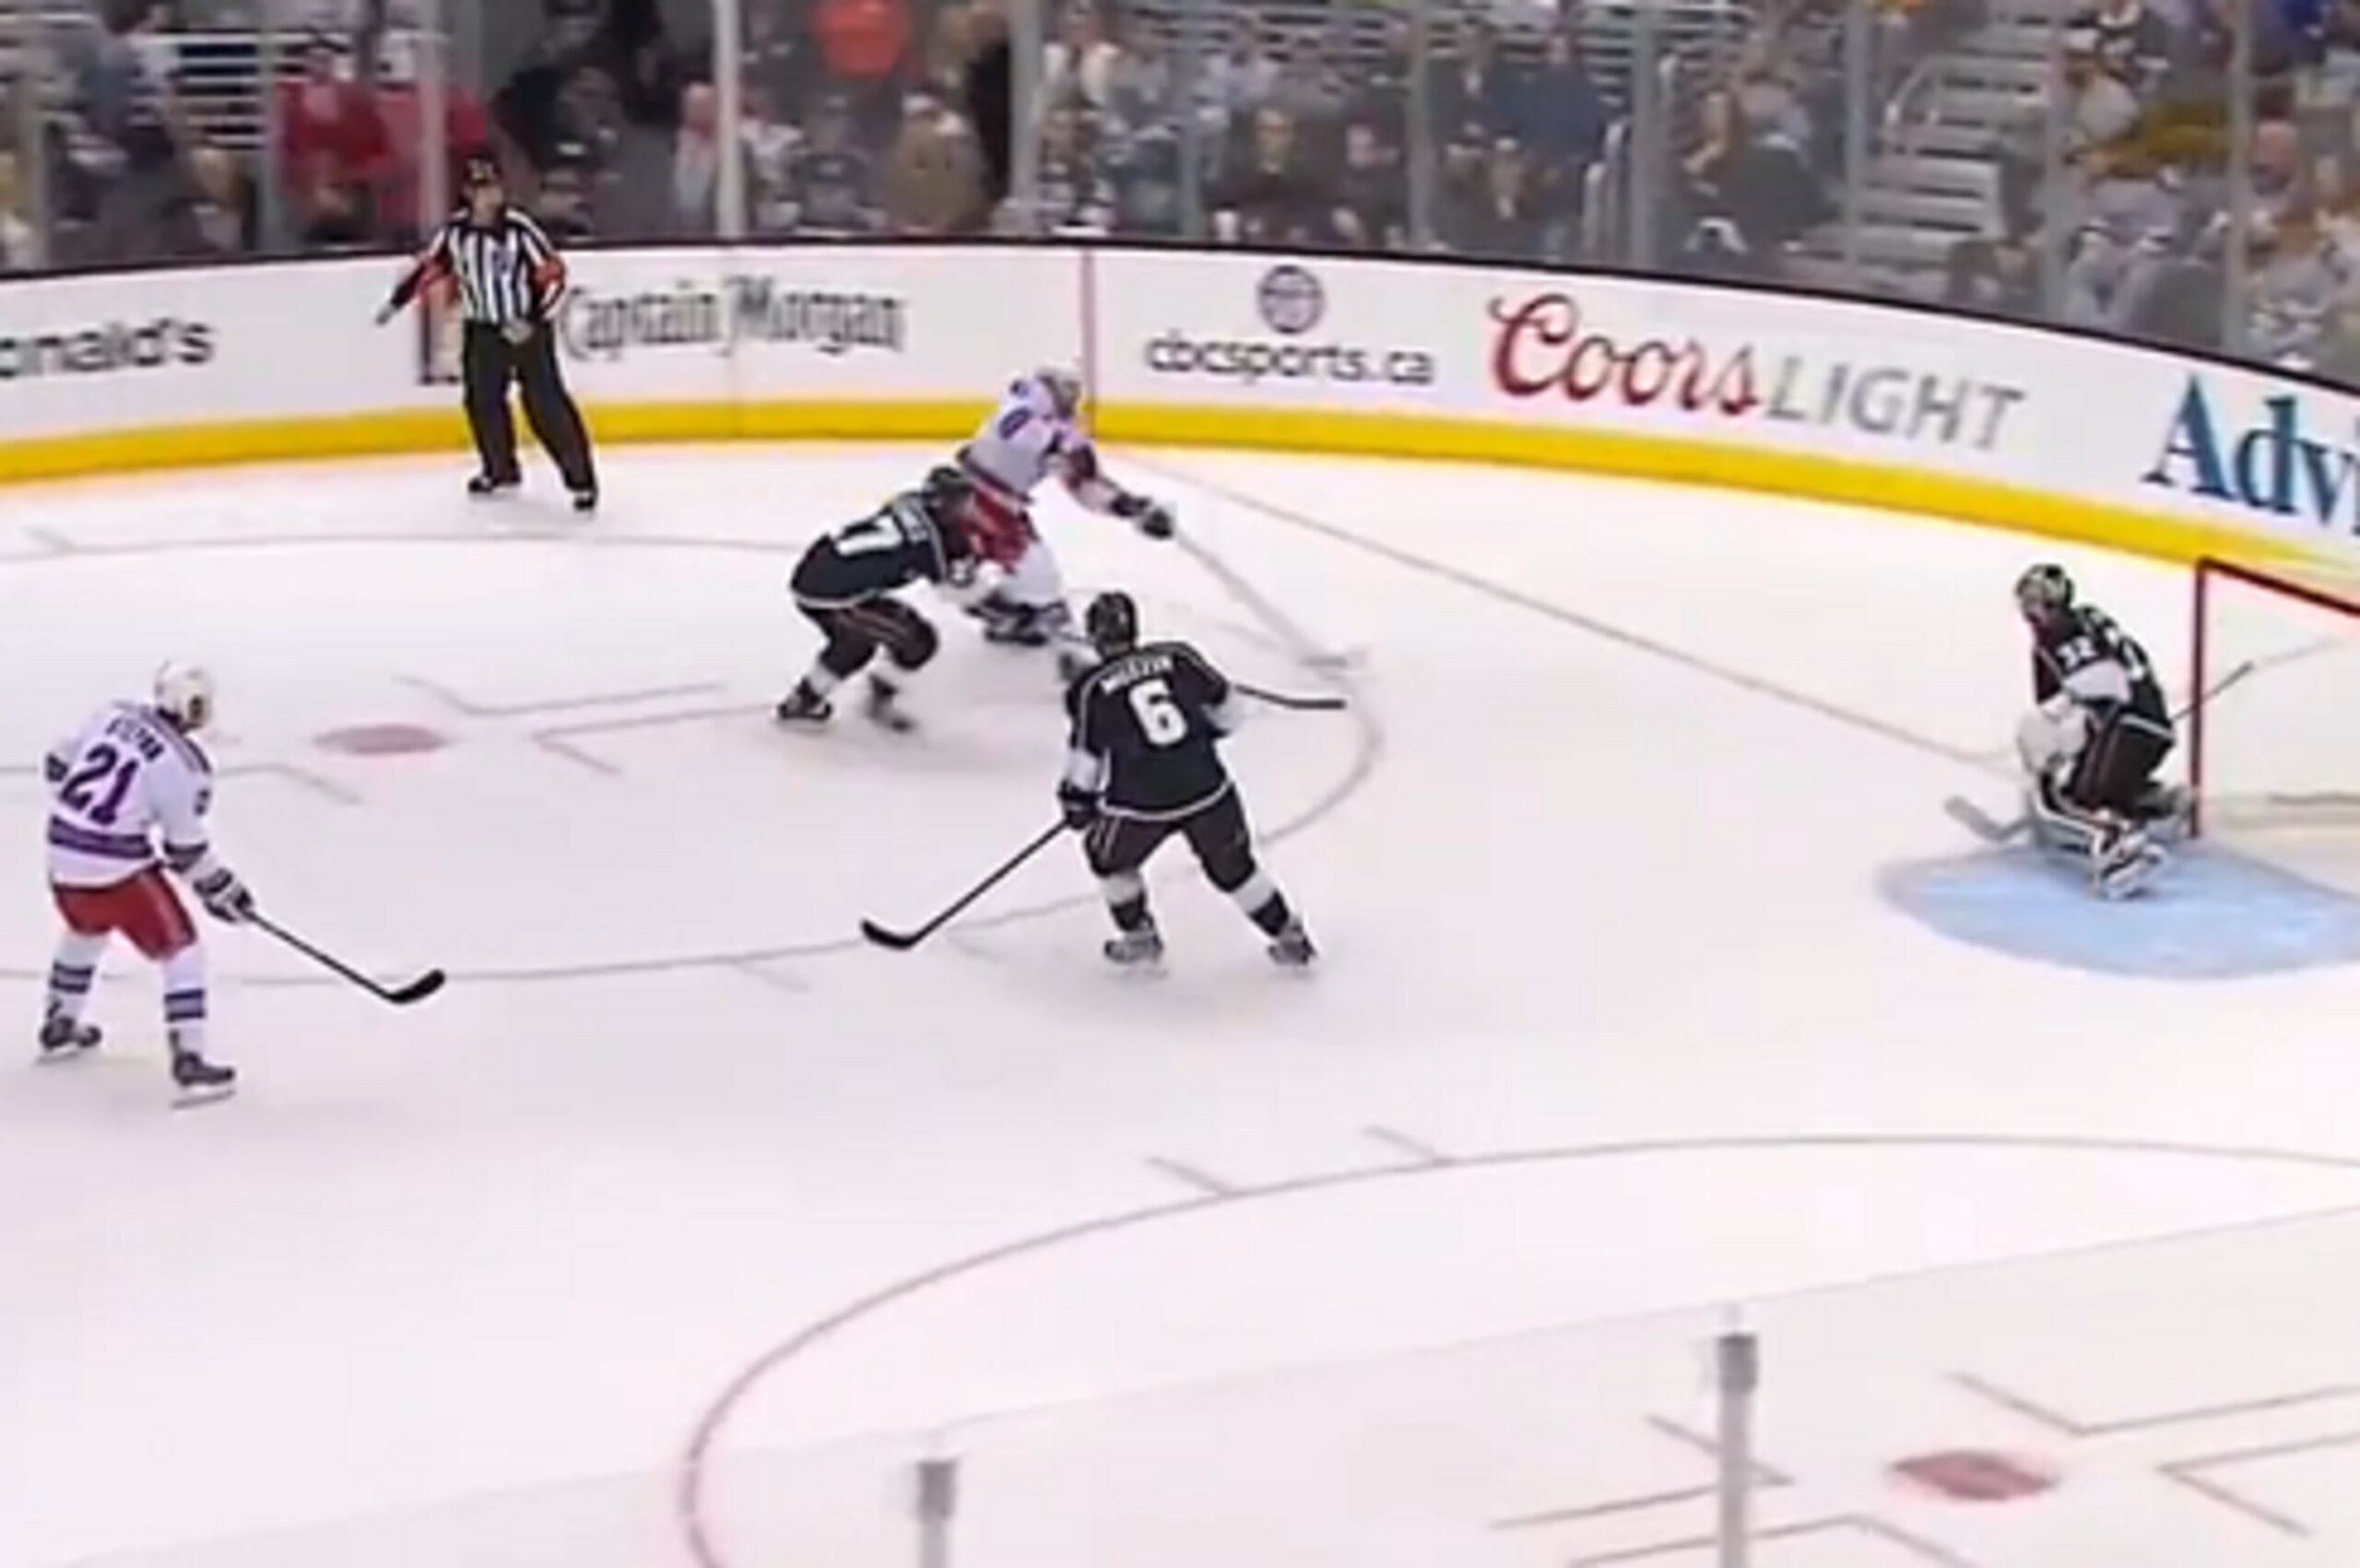
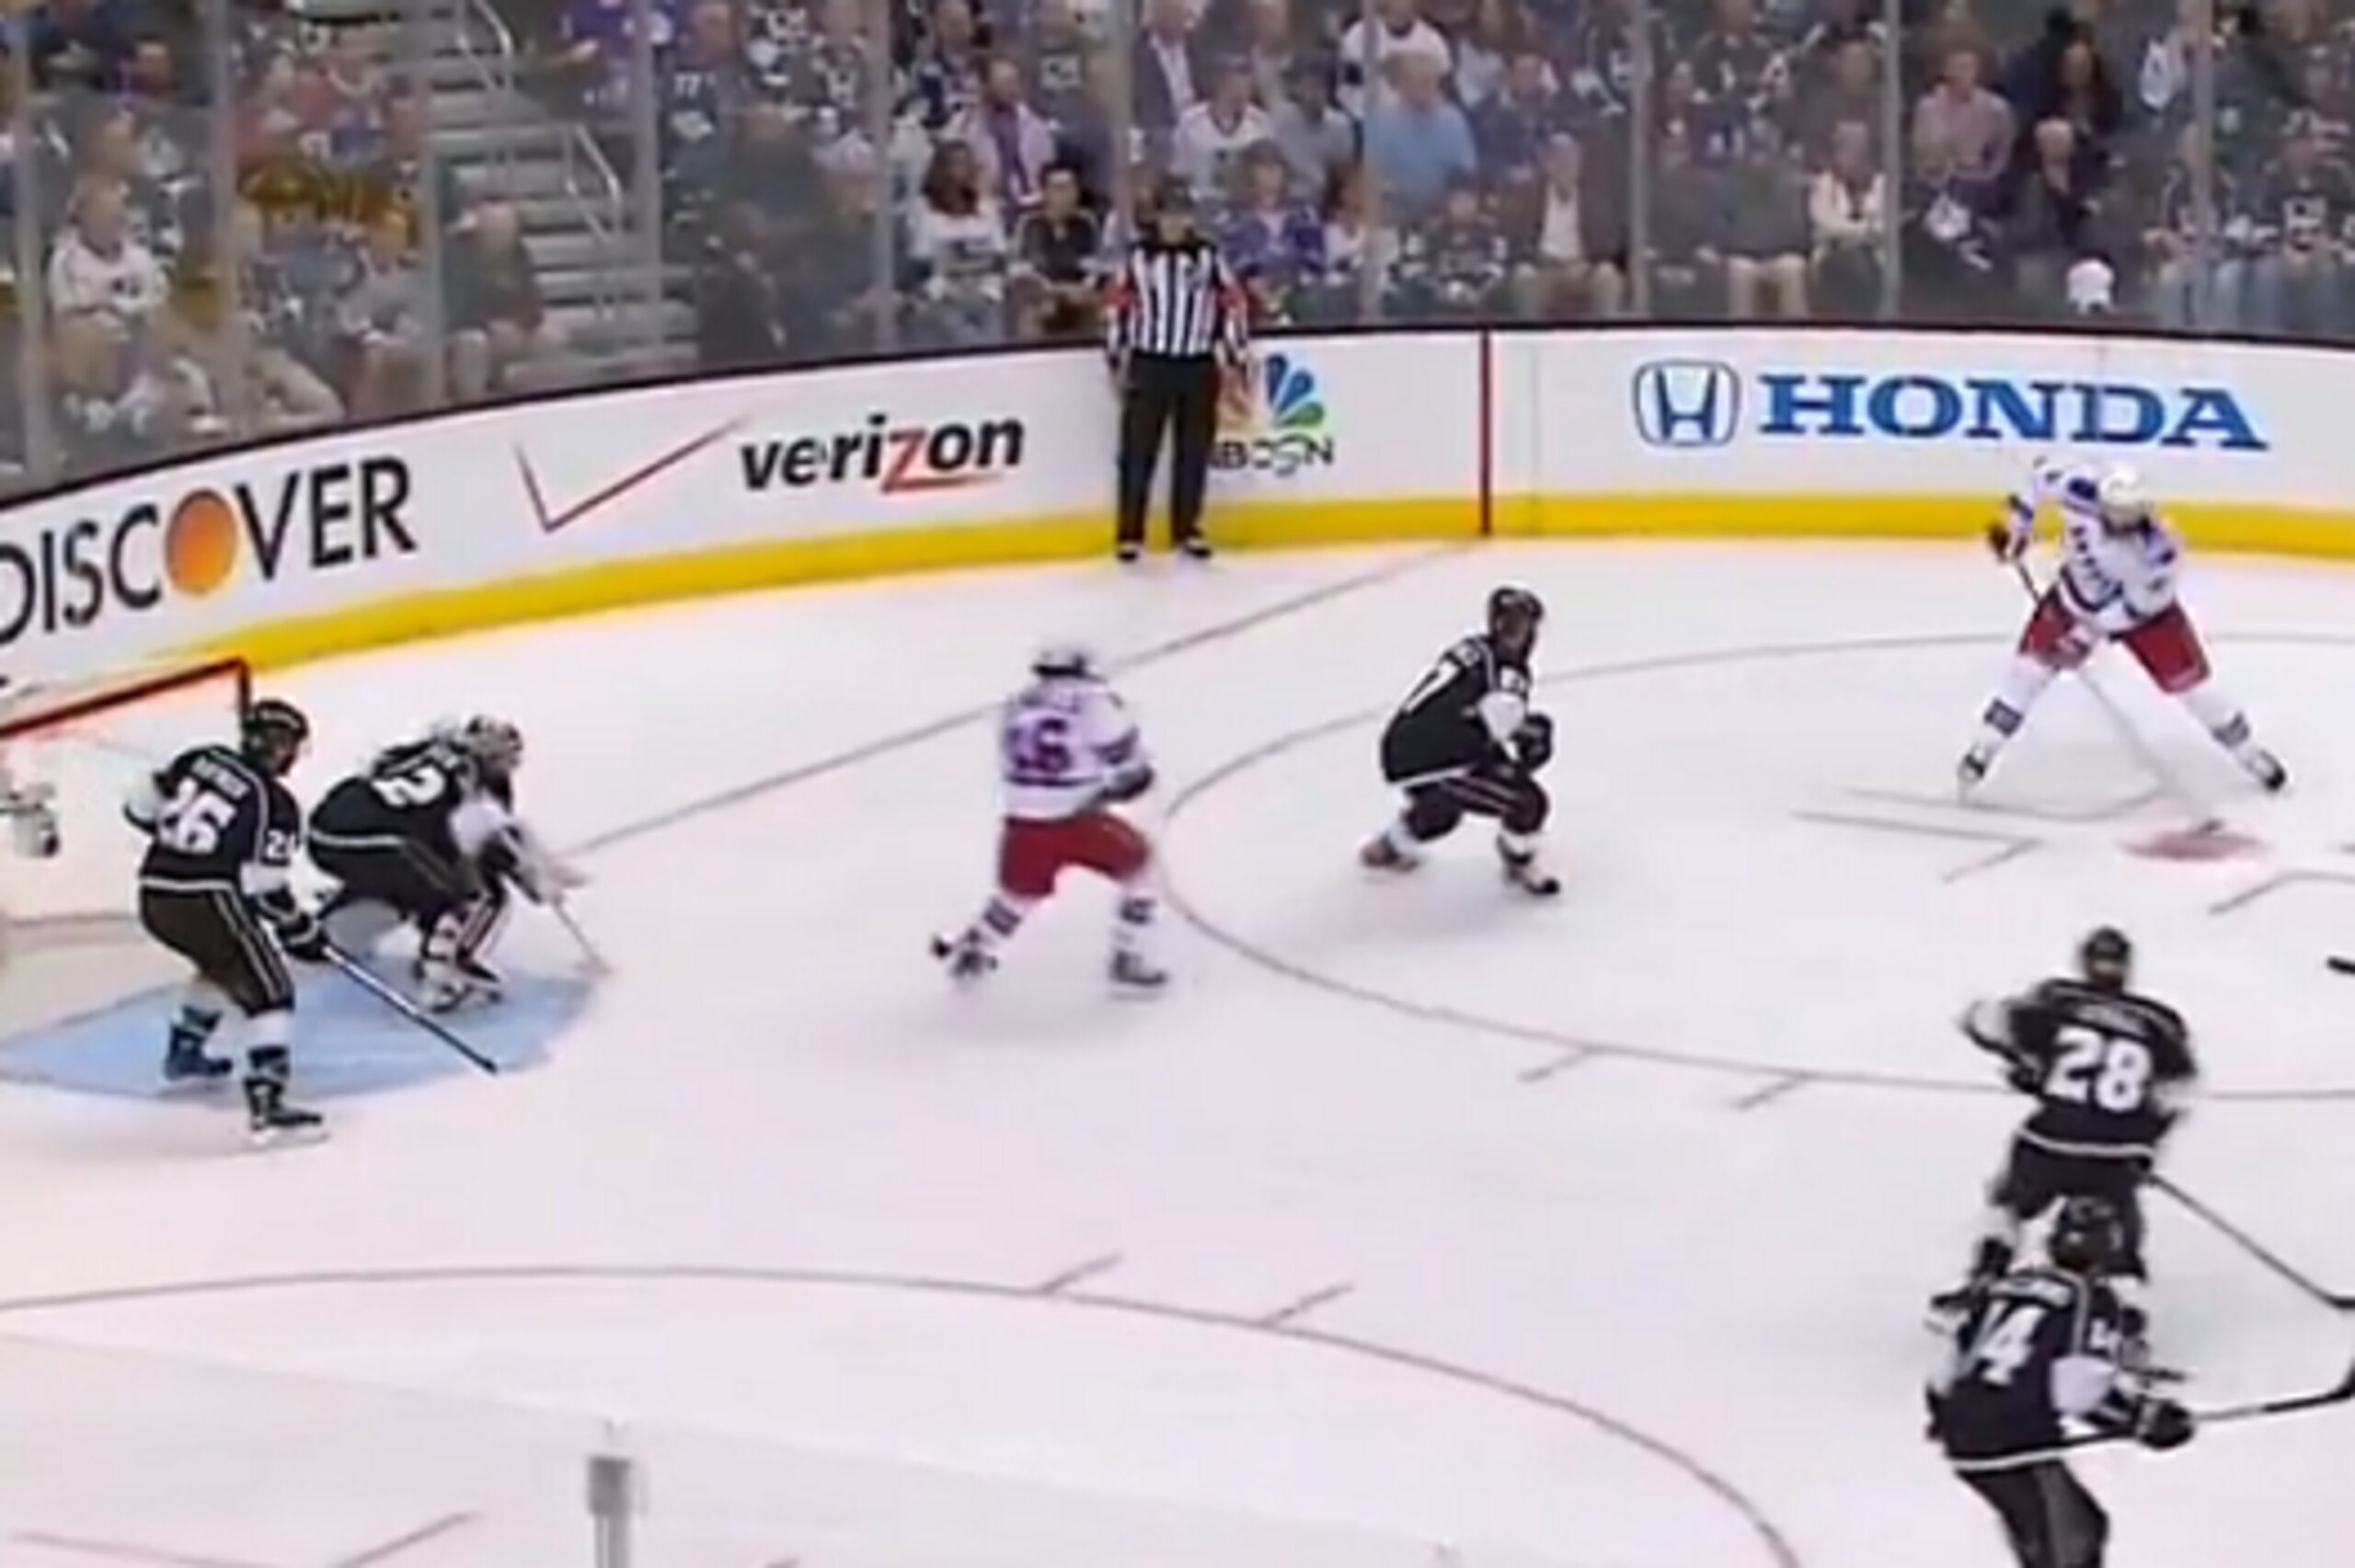
That first shot (short-handed) generated a rebound opportunity for Derek Stepan. The second was from a good location with traffic in front. Those are good shots to take, the kind that offer the Rangers a decent opportunity to score.
In other words, we may already be through to the other side.
Nash can’t erase two rounds of going goalless, but he delivered offence in Round 3 and looked pretty decent in that regard in his first test against Los Angeles, too.
The Kings can’t—and won’t—be complacent about him. There’s a good reason why nobody saw more of Nash in Game 1 than Drew Doughty—and why Matt Greene and Alec Martinez barely played at all against him.
Nash is both a player who drives on-ice results and a proven goal scorer in the NHL. He’s shown the first quality all playoffs, he started to show the second in Round 3 and now the challenge for the Kings is to stop both.
Jonathan Willis covers the NHL for Bleacher Report. Follow him on Twitter for more of his work.
Statistics courtesy of ExtraSkater.com, Hockey-Reference.com, TimeonIce.com and NHL.com.



.jpg?w=2560 "Dak to Stroud: Get Some Wins 💯")


.jpg?w=2560 "5 NFL Players Getting Trade Buzz")


.jpg?w=2560 "NFL Won't Fine 'Beverage' Celebrations 🍻")