
Ranking the Best and Worst Finishes to NBA Seasons
Eight is the magic number inside the NBA bubble.
That's how many games teams have to secure a playoff spot, jostle for postseason seeding or make their final preparations for a championship push. It's not even 400 minutes of game time (provided no extra sessions are needed), yet it could very well shape the outcome of the 2019-20 campaign.
Ending on a high note has never been more important, which got us thinking: What's the best close to a season in recent NBA history? And, since 2020 won't allow us to have nice things, what are the worst finishes to a campaign we've seen?
We'll let the stat sheet answer both questions by examining the 20 best and worst scoring differentials and net ratings over a club's final eight games since 1983-84 (as far back as the data is available). Then, we'll determine the four best and worst—you know, for a total of eight—by determining their average rank in wins (or losses) and our two statistical categories of choice.
Fourth-Best: 2003-04 San Antonio Spurs
1 of 8
Wins: 8 (Rank: Tied for first)
Scoring Differential: Plus-115 (Tied for seventh)
Net Efficiency Rating: Plus-16.8 (Sixth)
Champions the year before and the year after, San Antonio saved its strongest regular-season finish for a campaign in which it didn't escape the second round of the playoffs.
For more than a month, the Spurs looked (and were) unbeatable. They won three in a row prior to this specific stretch, meaning they sprinted to the finish line on an 11-game winning streak. Six of their final eight victories were decided by double digits; another was a nine-point victory. The Spurs really only sweated once in this eight-game stretch, and that was in a six-point road triumph over the Los Angeles Lakers.
The Spurs subsequently swept the sixth-seeded Memphis Grizzlies out of the opening round and then grabbed a 2-0 lead on the second-seeded Lakers in the conference semis. But San Antonio dropped Game 3—its first loss in nearly seven weeks—and Game 4 on the road, returned home only to get gut-punched by Derek Fisher's game-winning shot with 0.4 seconds remaining in Game 5 and was eliminated away from home in Game 6.
Third-Best: 1991-92 Utah Jazz
2 of 8
Wins: 7 (Tied for seventh)
Scoring Differential: Plus-143 (Third)
Net Efficiency Rating: Plus-18.7 (Third)
Something special was brewing in Salt Lake City, where the Jazz had assembled the Hall of Fame trio of Karl Malone, John Stockton and coach Jerry Sloan. Once the skipper grabbed the reins during the 1988-89 campaign, this core became a 50-plus-win powerhouse.
It matched its then-high mark of 55 triumphs this season thanks to a furious finish. The Jazz closed the campaign on a seven-game winning streak, six decided by 11 points or more and four by margins of 23-plus points. If not for a head-scratching loss to start this final eight-game stretch—the Jazz lost to a 15-win Minnesota Timberwolves team that shot 38.8 percent in the contest—this closing surge could've ranked even better.
It was, predictably, keyed by Stockton and Malone. The former averaged an absurd 14.5 assists against 3.5 turnovers. The latter supplied 30.3 points per game on 55.0 percent shooting. It was surgical execution at its finest.
The Jazz would make their first-ever appearance in the Western Conference Finals, where they lost in six games to the top-seeded Portland Trail Blazers.
Second-Best: 1988-89 Phoenix Suns
3 of 8
Wins: 7 (Tied for seventh)
Scoring Differential: Plus-167 (First)
Net Efficiency Rating: Plus-20.3 (First)
The Suns were merely trying to lay a foundation during the 1988-89 season. They wound up creating a contender.
A 1987-88 deadline deal netted them Kevin Johnson and the first-round pick that became Dan Majerle. That summer, general manager Jerry Colangelo also inked All-Star forward Tom Chambers to a deal that made him the first unrestricted free agent to sign a contract with a new team. The Johnson-Chambers connection became transformative for the team.
"K.J., who was one of the quickest guards, explosive guards in the NBA, who had the ability to finish and also pull up for jump shots, and Chambers, who was an offensive machine, the two of them played extremely well together," Colangelo said.
Johnson and Chambers kept the pedal floored right through the stretch run, which saw the Suns obliterate one opponent after the next.
Even with an 11-point loss to the Houston Rockets thrown in there, the Suns had the best differentials of any team in this nearly 40-year sample. That had a lot to do with drubbing bad San Antonio Spurs and Sacramento Kings teams (by 46 and 55 points, respectively), but six of the club's final seven victories were decided by double digits, five by at least 15 points. Phoenix's run didn't stop until the conference finals, where it was swept by the Los Angeles Lakers.

.jpg?w=3840)

Best: 1993-94 Indiana Pacers
4 of 8
Wins: 8 (Tied for first)
Scoring Differential: Plus-154 (Second)
Net Efficiency Rating: Plus-19.8 (Second)
The Pacers had quietly collected a strong nucleus in the early 1990s. They just needed the right coach to bring out their best. Larry Brown proved the perfect person for the gig.
It wasn't always clear that Brown was the right choice, as the club dropped its first three games, six of its first seven and 23 of its first 39. But the proverbial switch flipped at the midway point of the season, and the Pacers proved a wrecking ball from there on out. They went 31-12 the rest of the way, closing with an eight-game winning streak in which six of the games were decided by double figures and four had at least 18-point margins.
Reggie Miller keyed the run with a mind-numbing shooting display, even by his standards. The 6'7" sniper averaged 20.6 points on 54.3/58.3/93.8 shooting. He was taking 4.5 three-pointers a night—for context, the Pacers only averaged 6.1 attempts as a team that season and weren't last in the category—and splashing nearly 60 percent.
As if out to display the full array of his offensive talent, Miller had three games in this stretch with at least four triples, another three games with at least seven free throws and four outings with five-plus assists.
Indiana's 47 victories were its most since the NBA/ABA merger, and its subsequent trip to the conference finals was also its first of the post-merger era. The Pacers lost that series in seven games to the New York Knicks.
Fourth-Worst: 1993-94 Minnesota Timberwolves
5 of 8
Losses: 0 (Tied for first)
Scoring Differential: Minus-126 (Fifth)
Net Efficiency Rating: Minus-16.3 (Fifth)
An expansion team in 1989-90, the Timberwolves were still finding their way in their fifth season of existence. They had just paired 1992's No. 3 pick, Christian Laettner, with 1993's No. 5 selection, Isaiah Rider, and basically let the kids run wild.
Laettner was the scoring leader. Rider paced the club in shots. Collectively, box plus/minus valued the youngsters as being worth minus-0.5 points per 100 possessions as Rider's minus-1.7 mark canceled out Laettner's plus-1.2 and then some.
Minnesota opened the season with five straight losses and basically stayed dreadful throughout the season. The Wolves' stretch run was more like a fall down the stairs: 10 consecutive losses, two decided by fewer than 10 points.
The eight-game sample for our purposes featured seven double-digit losses and three decided by at least 18 points. Minnesota's defense allowed at least 116 points in five of the losses, and its offense couldn't crack 90 points in the other three.
Third-Worst: 2000-01 Golden State Warriors
6 of 8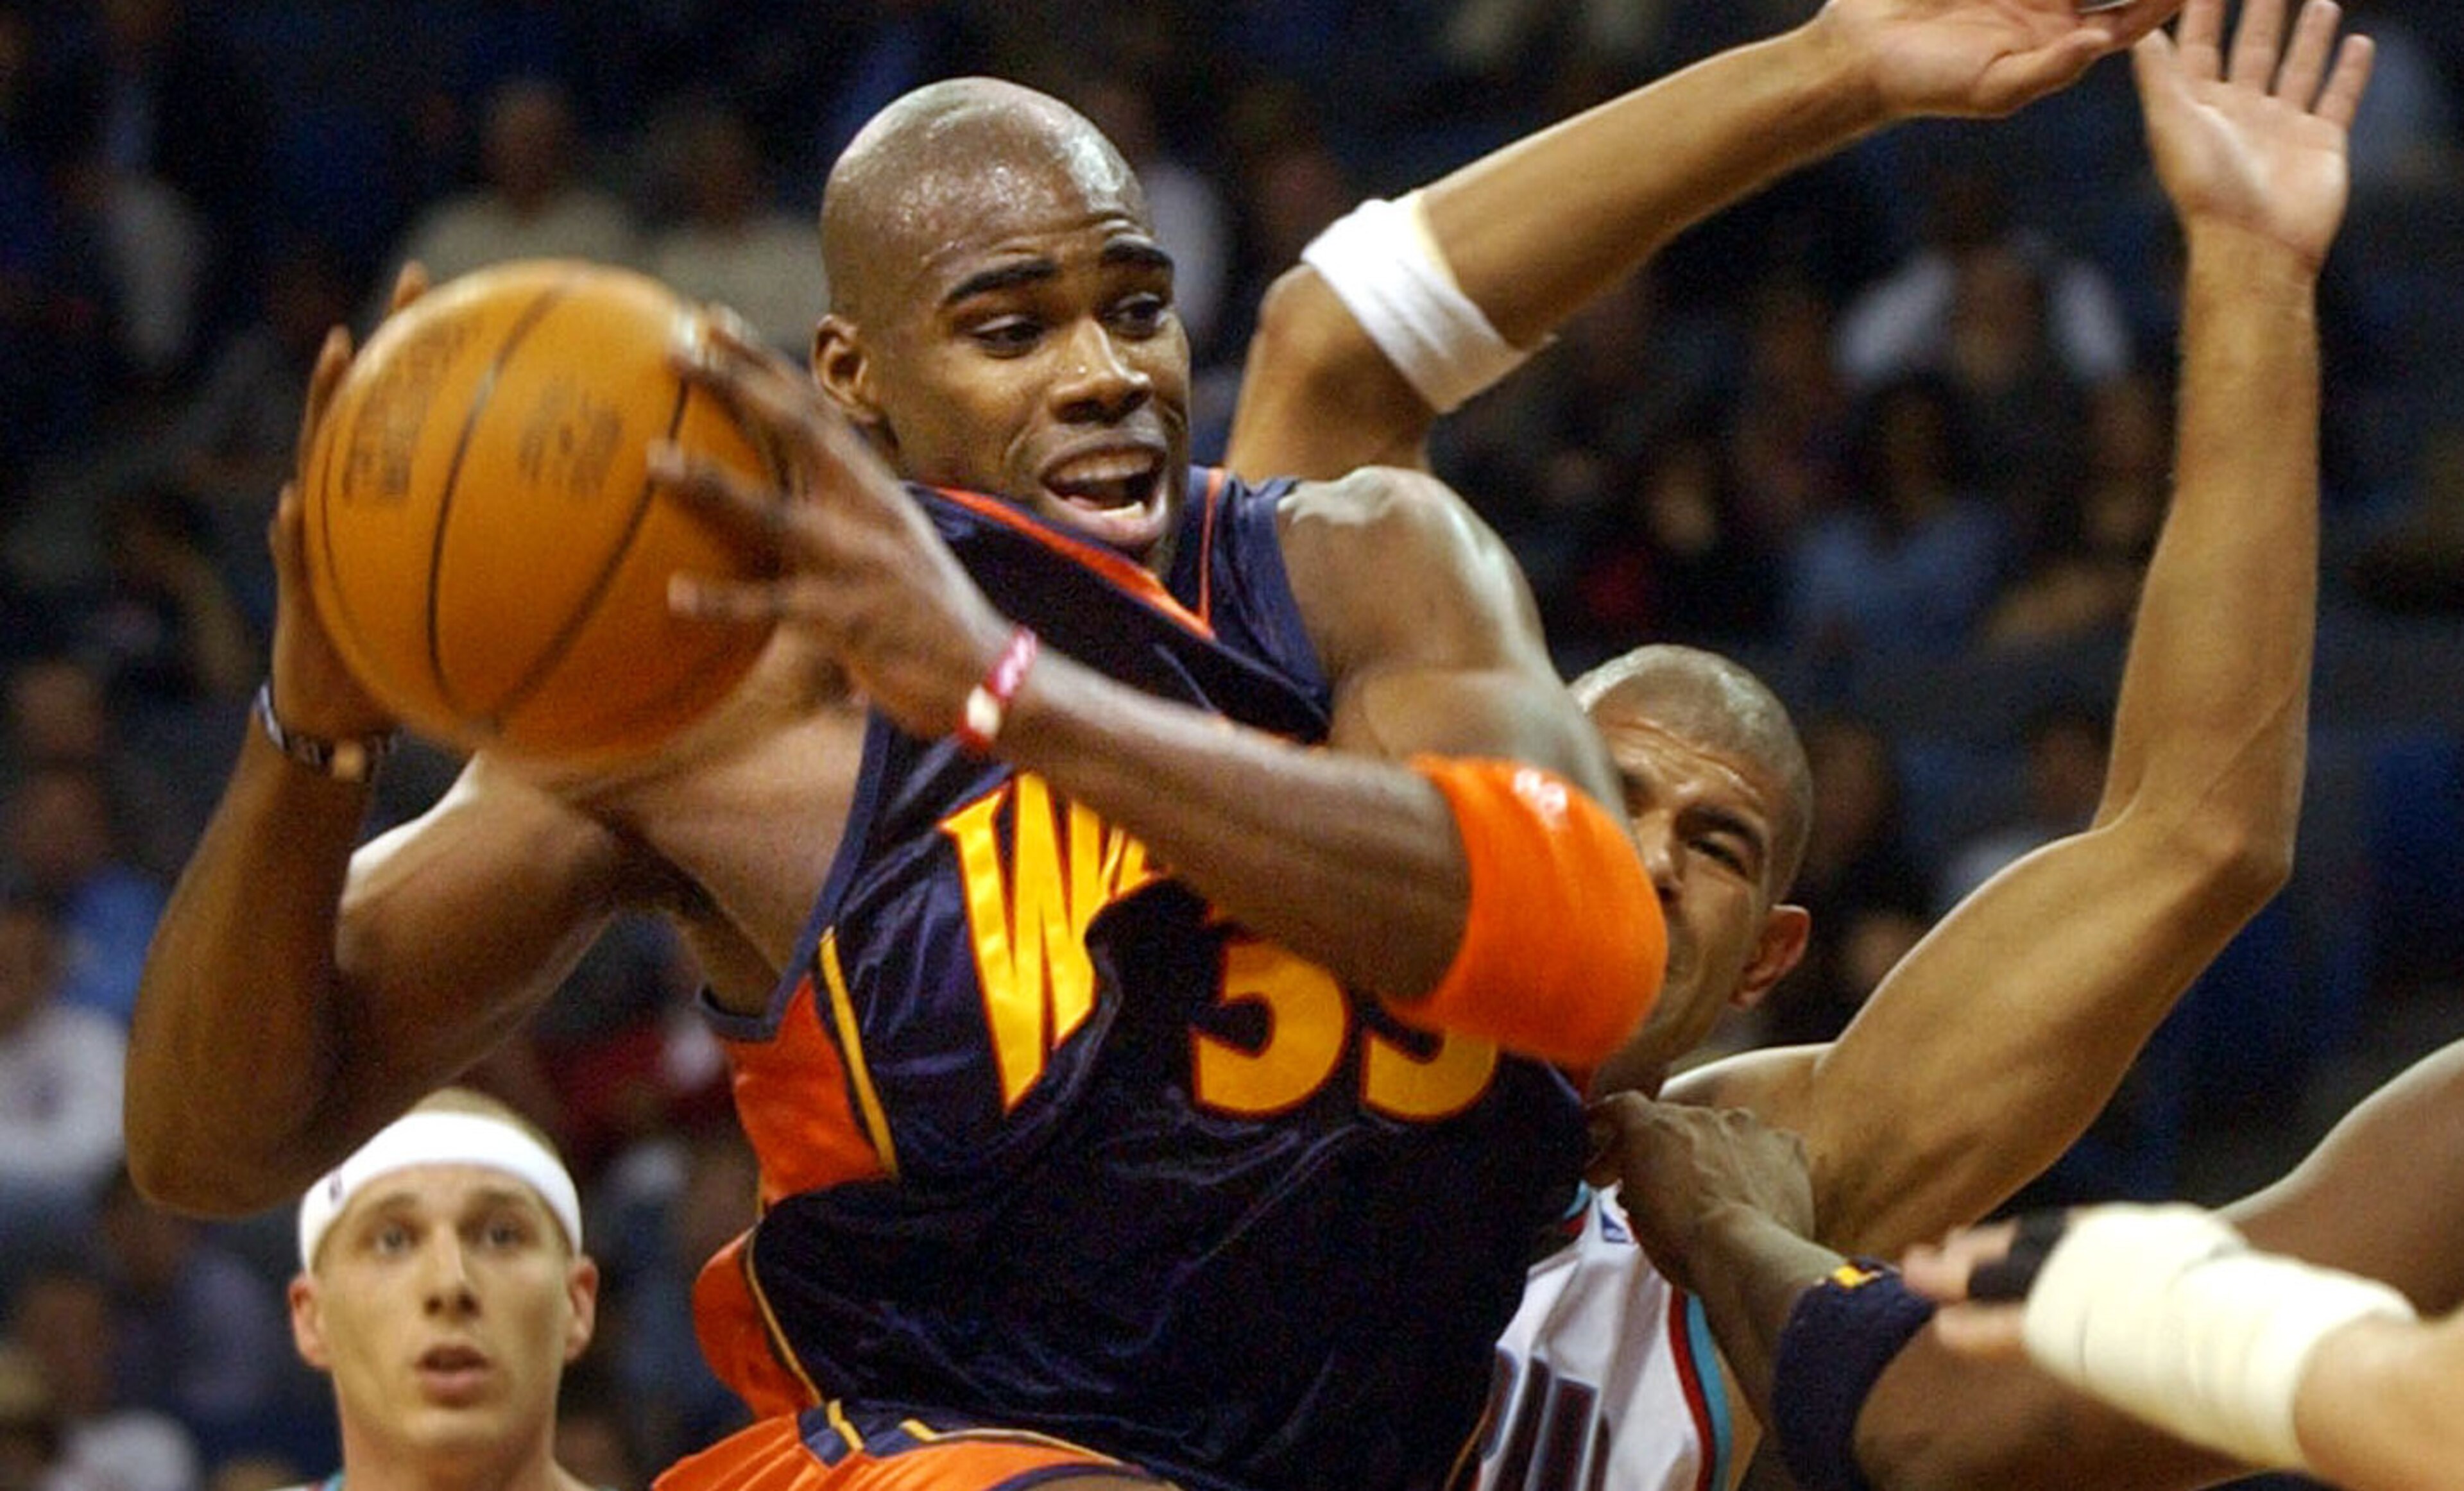
Losses: 8 (Tied for first)
Scoring Differential: Minus-124 (Eighth)
Net Efficiency Rating: Minus-17.0 (Second)
Technically, the Warriors' average rank puts them in a dead tie with the aforementioned Timberwolves, so simple rating system—a metric that weighs average point differential and strength of schedule—was used to settle the score. While Minnesota's minus-6.54 mark is nothing to write home about, it's good enough to clear Golden State's minus-8.11.
These Warriors were simply brutal. They played with no real purpose other than operating at the fastest possible speeds (second in pace). The Warriors ranked second to last on offense and third from the bottom on defense.
They had a few young, interesting prospects (namely, Antawn Jamison and Larry Hughes), but they had no support around them. Jamison played all 82 games and averaged 41.4 minutes a night. Head coach Dave Cowens, who was out of Oakland just 23 games into the following season, even tasked a past-his-prime, 33-year-old Mookie Blaylock with 34.1 minutes per game.
The whole season was hard to stomach—they had seven losing streaks of at least five games—but the ending was especially atrocious. Golden State was 2-32 after the All-Star break, and it finished the year with 13 consecutive losses. Among the eight included in our sample were five double-digit defeats, two against teams with 50-plus losses (the 51-loss Los Angeles Clippers and 59-loss Vancouver Grizzlies).
Second-Worst: 1988-89 San Antonio Spurs
7 of 8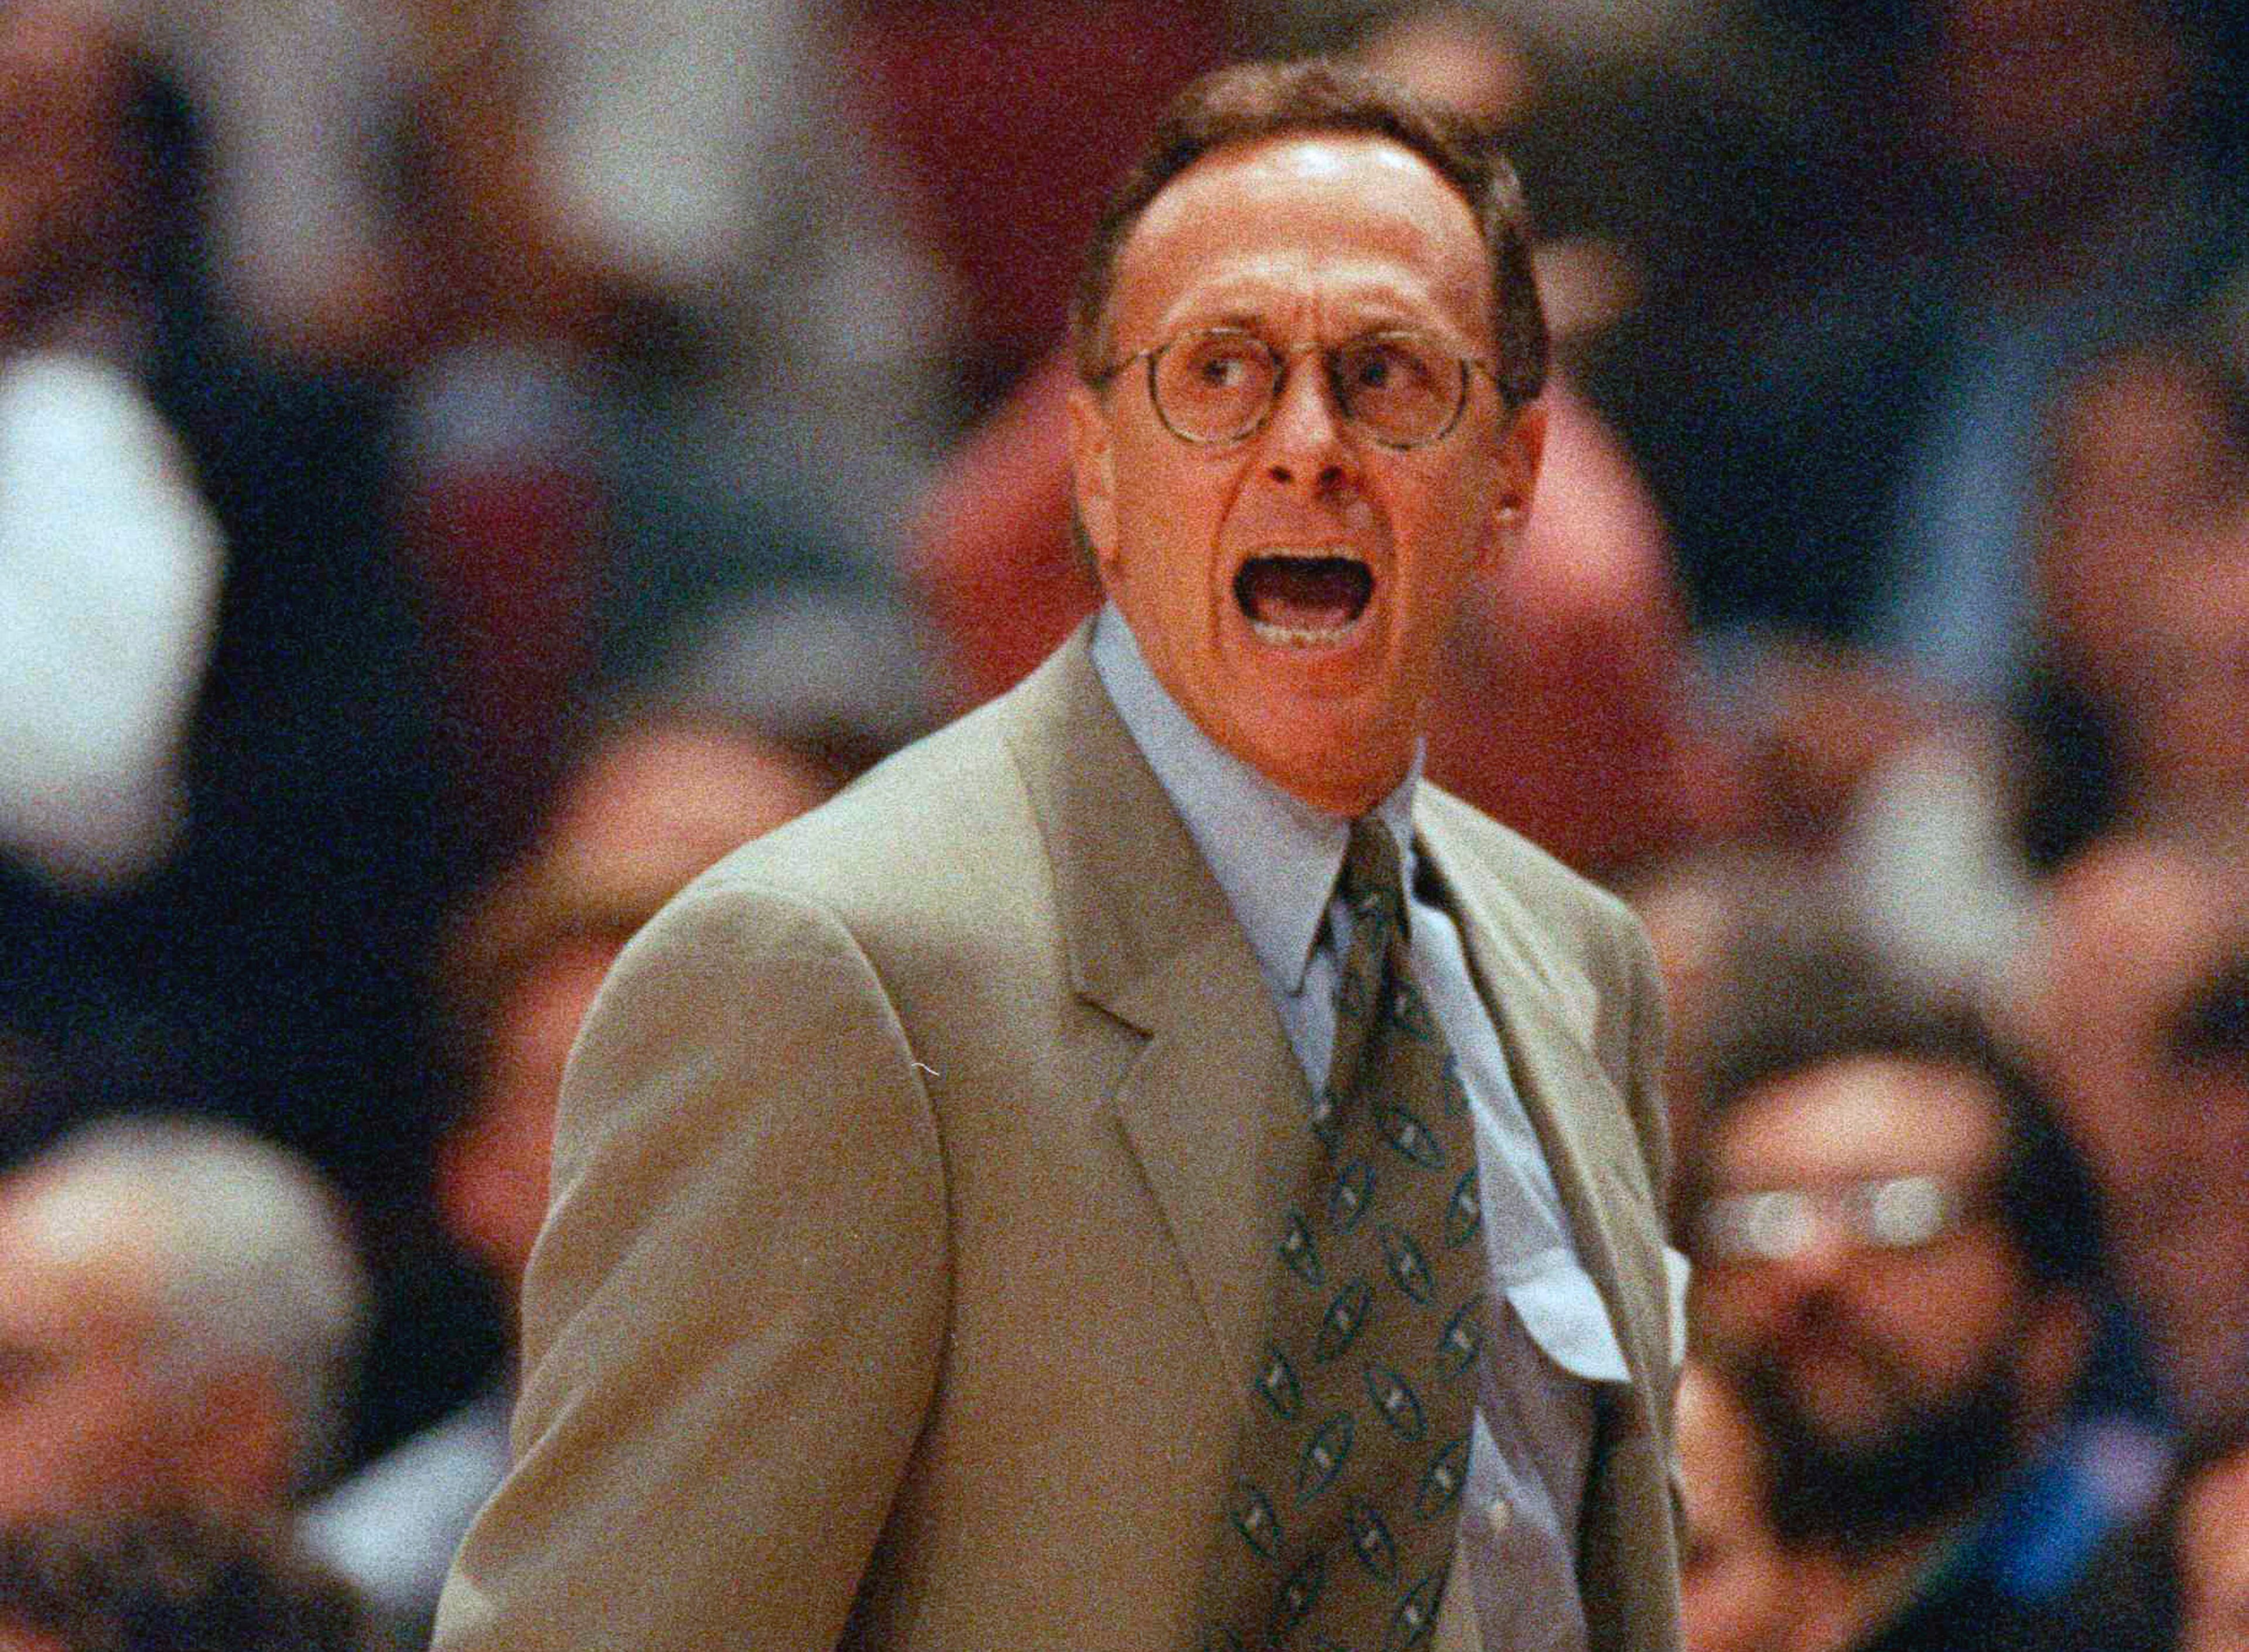
Losses: 8 (Tied for first)
Scoring Differential: Minus-130 (Third)
Net Efficiency Rating: Minus-16.1 (Sixth)
If your brain can't help but conjure up images of Tim Duncan, Gregg Popovich or David Robinson upon mention of the Spurs, you might not remember (or know) that the Alamo City wasn't always home to a hoops power.
San Antonio didn't have many stumbles, but 1988-89 was one of its worst. It was still waiting for Robinson, the top pick in 1987, to complete his two-year commitment to the Navy, so it instead left the offense in the hands of rookie Willie Anderson. The 10th pick in 1988, Anderson paced the Spurs in points (18.6), field-goal attempts (15.9) and usage percentage (23.8) and then never approached those numbers again in his nine-year career.
The Spurs essentially spent the year in a holding pattern. They hired Larry Brown as head coach in 1988, and his biggest draw to the Lone Star State was the eventual opportunity to coach Robinson.
"Larry wasn't really interested in San Antonio," former Spurs owner B.J. "Red" McCombs told Mike Monroe of the San Antonio Express-News in 2009. "... But he was interested in coaching David. The deal with Larry wouldn't have happened without David."
The Spurs sputtered to a 21-61 record, low-lighted by a nine-game losing skid to end the season. The Spurs' final eight games included five double-digit losses, one of which was a 46-point drubbing by the Phoenix Suns.
Worst: 1986-87 Los Angeles Clippers
8 of 8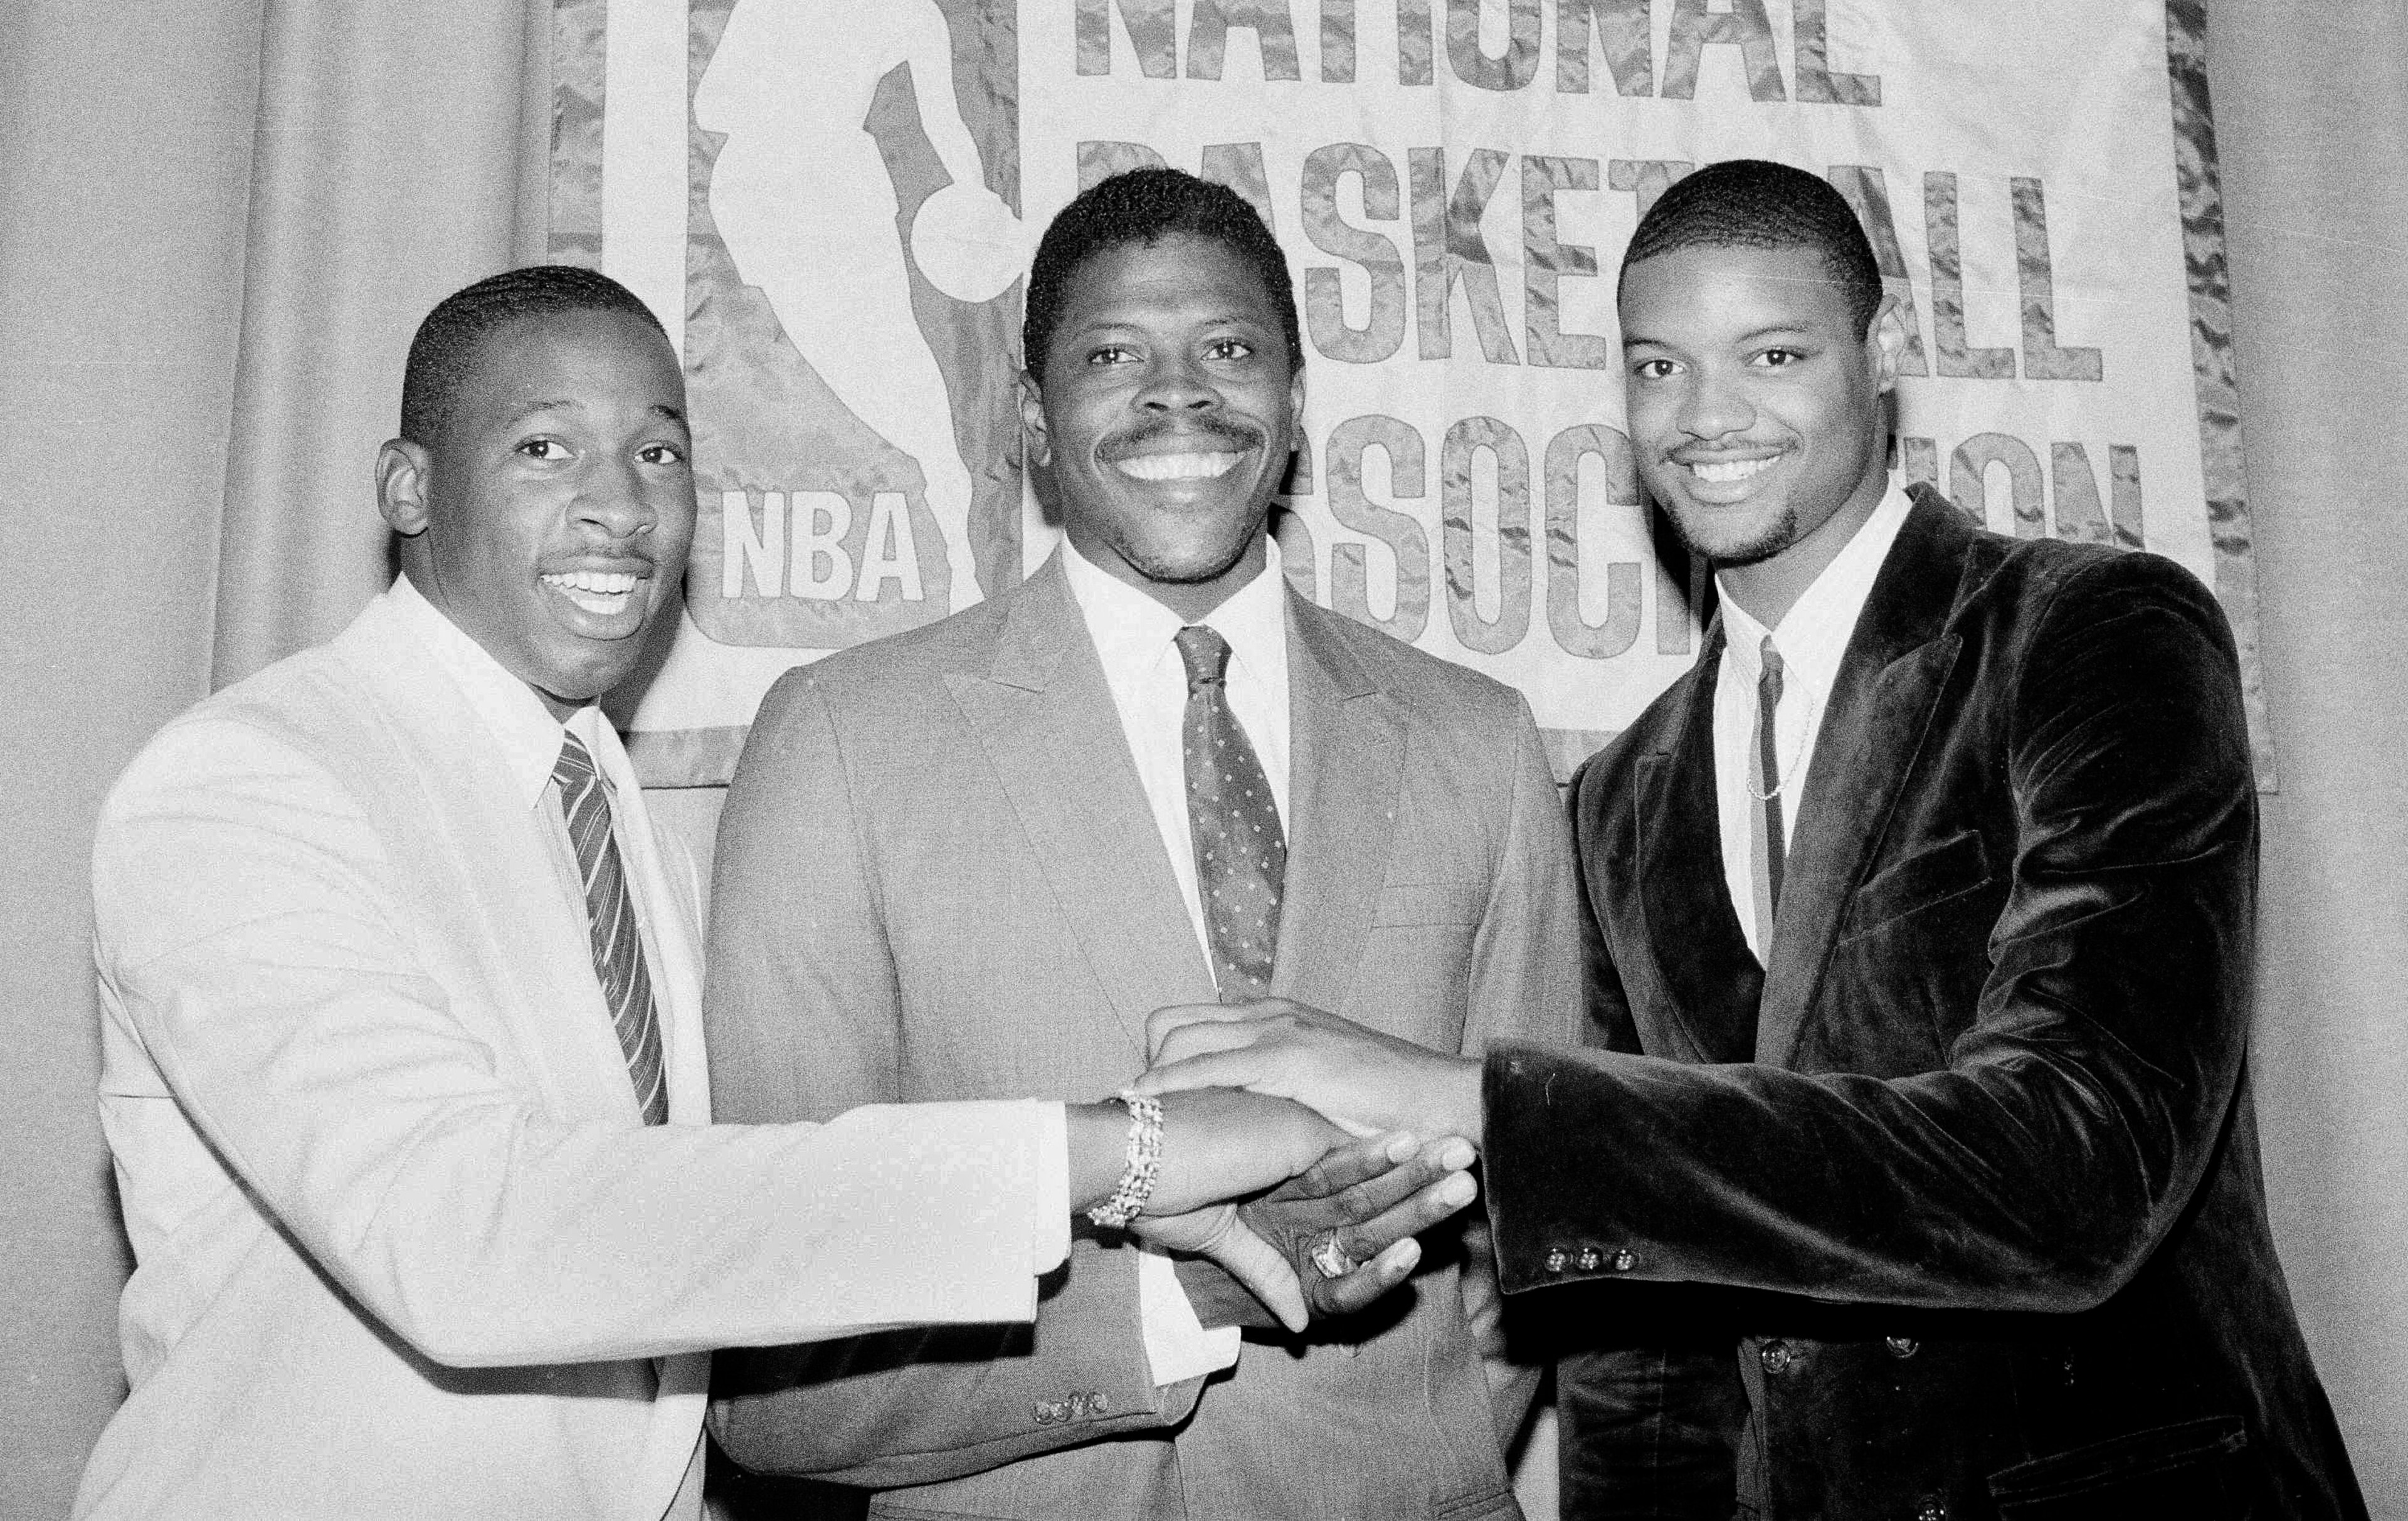
Losses: 8 (Tied for first)
Scoring Differential: Minus-153 (First)
Net Efficiency Rating: Minus-18.9 (First)
When B/R's Kerry Miller assembled a list of the 10 worst teams in NBA history in April, these Clippers made the cut at sixth overall. They were the only team from that list to make this one, so...congrats?
"From 1981-82 through 1990-91, the Clippers had 10 consecutive seasons with a winning percentage of 0.390 or worse," Miller wrote. "This was clearly their lowest point during that stretch, but this wasn't some calculated effort to get bad in order to get better. They were simply an embarrassment for an entire decade."
Despite routinely drafting near the top of the first round, the Clippers didn't keep the players long enough to reap the rewards. They discarded Tom Chambers after two seasons, did the same with Terry Cummings and traded Byron Scott before he played a game for them. Benoit Benjamin, pictured above with Patrick Ewing and Wayman Tisdale at the 1985 draft, stuck around for five-plus seasons, but he never became what they hoped they were getting with the No. 3 pick.
The Clippers won 12 games all season—and that was after starting the year 3-3, so you can imagine what the latter half looked like. They had three wins to show for the month of February, two in all of March and none in April. When the checkered flag mercifully ended their season, they were flat-lining on a 14-game losing streak.
Only one of their final eight losses was decided by fewer than 13 points, and that was a nine-point defeat. Five losses came by at least an 18-point margin, and three were decided by 20-plus points.
All stats courtesy of NBA.com, Basketball Reference and Stathead unless otherwise noted.
Zach Buckley covers the NBA for Bleacher Report. Follow him on Twitter, @ZachBuckleyNBA.


.jpg?w=3840 "Overlooked Rookies to Watch in Camp 🔎")

