
B/R's All-2000s MLB Team: Who Joins Barry Bonds and Clayton Kershaw?
On March 29, 2000 in Japan, Mike Hampton threw the first pitch of the new millennium. On Nov. 1, 2017 in Los Angeles, Charlie Morton threw the millennium's most recent pitch.
In between, over 5,000 players have come, gone or are still sticking around in Major League Baseball. Since that's far too many to sift through, let's focus on the players who absolutely everyone must know.
Behold, Bleacher Report's All-2000s MLB team.
Similar to B/R's All-2000s NBA team, the idea is construct a legitimate 25-man roster that has a starting nine with a designated hitter, a four-man bench, five starting pitchers and a seven-man bullpen. Going into these slots are the best and the brightest stars at each position.
The first rule is that only what's happened since 2000 matters. Otherwise, players were selected based on a multitude of factors. Overall performance (total wins above replacement) matters. So does peak performance (a player's average WAR in his five best seasons). Also, postseason heroics, accolades and anything else that shapes players' legacies.
These are the 25 players who best define Major League Baseball in the 21st century. The headline spoils two of them. Read on to find out the rest.
Starting Catcher: Joe Mauer
1 of 14
Years Active: 2004-2017
Key Statistics: 1,731 G, 7,417 PA, .308 AVG, .391 OBP, .443 SLUG, 137 HR
Total WAR: 53.4
Peak WAR Average: 6.1
Accolades: 2009 American League MVP, six-time All-Star, three-time Gold Glove winner, five-time Silver Slugger
Joe Mauer was destined to end up here.
The Minnesota Twins took the St. Paul native with the No. 1 pick in the 2001 draft. He was Baseball America's No. 1 prospect by 2004, at which point they declared: "There's nothing not to like about Mauer."
He began to show why later that year by breaking into The Show with a .308/.369/.570 slash line in 35 games. Fast-forward nine years to 2013, and there he was with a stack of various awards and attention-grabbing numbers.
As a hitter, Mauer boasted a .323/.405/.468 slash line across 5,060 plate appearances. He could hit a line drive in any direction he wanted, whenever he wanted. Throw in a sharp eye and occasional power, and he was all you could ask for and then some as an offensive producer from behind the dish.
Defensively, Mauer wasn't quite the equal of Yadier Molina. But he was a quality receiver, and he didn't let his 6'5", 225-pound frame keep him from controlling the running game. He put up a solid 33.2 caught-stealing percentage.
Alas, age and injuries finally forced Mauer out of the crouch in 2014. He can nonetheless rest easy knowing this, though: For 10 years, he treated baseball fans to a glimpse of a catcher who was somehow now too good to be true.
Starting First Baseman: Albert Pujols
2 of 14
Years Active: 2001-2017
Key Statistics: 2,575 G, 11,188 PA, .305 AVG, .386 OBP, .561 SLUG, 614 HR
Total WAR: 99.4
Peak WAR Average: 8.9
Accolades: Three-time National League MVP, 2001 NL Rookie of the Year, 10-time All-Star, two-time Gold Glove winner, six-time Silver Slugger winner, two-time World Series champion
Anyone who started watching baseball in 2012 has only witnessed Albert Pujols as a one-note slugger whose $240 million contract has been a disaster for the Los Angeles Angels.
Anyone who watched him between 2001 and 2011, however, will know him as one of the greatest players to ever put on a baseball uniform.
Although he arrived as a relatively unheralded prospect in 2001, Pujols started hitting right away with a .329/.403/.610 slash line and 37 home runs. Then he just kept hitting. And hitting. And hitting. And hitting. And...
Well, repeat that as many times as it takes to fully encapsulate a .328/.420/.617 slash line and 445 home runs over 11 seasons. His bat also did its part to deliver his two World Series rings, producing a 1.046 OPS and 18 homers in 74 postseason games.
And Pujols was no one-trick Clydesdale during his heyday with the St. Louis Cardinals. He was a great defensive first baseman and a quality baserunner. Those talents combined with his offensive mega-production to create 11.1 more WAR than any other position player between 2001 and 2011.
Even as he's declined with the Angels, Pujols has at least kept the power coming by drilling 169 home runs. His career total stands at 614, placing him at No. 7 all-time and...[drum roll]...at No. 1 for the 2000s.
Starting Second Basemen: Robinson Cano
3 of 14
Years Active: 2005-2017
Key Statistics: 1,998 G, 8,493 PA, .305 AVG, .354 OBP, .494 SLUG, 301 HR
Total WAR: 65.7
Peak WAR Average: 7.7
Accolades: Eight-time All-Star, two-time Gold Glove winner, five-time Silver Slugger, 2009 World Series champion
The conventional wisdom holds that, due to the toll it takes to play the position, second basemen don't have much lasting power.
Don't tell that to Robinson Cano.
Cano just wrapped up his 13th MLB season with a .280/.338/.453 slash line and 3.4 WAR in 150 games for the Seattle Mariners. Not his best work, to be sure, but productive enough to qualify as a good season.
What's amazing about Cano's career is how rarely he's dipped under that particular threshold. He's had just one truly bad season, when he struggled every which way en route to 0.2 WAR in 2008. In nine seasons since then, his 54.9 WAR is more than all but one other player.
He owes much of his success to a swing that's sweet enough to eat yet dangerous enough to be bound in yellow caution tape. He's hit over .300 eight times and has launched 43 more homers than any other second baseman since the turn of the century.
Despite his Gold Gloves, it's always been harder to render judgment on Cano's defense. It's nonetheless undeniable that he's often made playing defense look cool by tracking down balls and making throws with fluid motions that make him reminiscent of baseball's answer to Stephen Curry.
Even at this point, it's not too early to mention Cano as a candidate for Cooperstown. And at the rate he's going, he's only going to get more deserving.


Starting Shortstop: Derek Jeter
4 of 14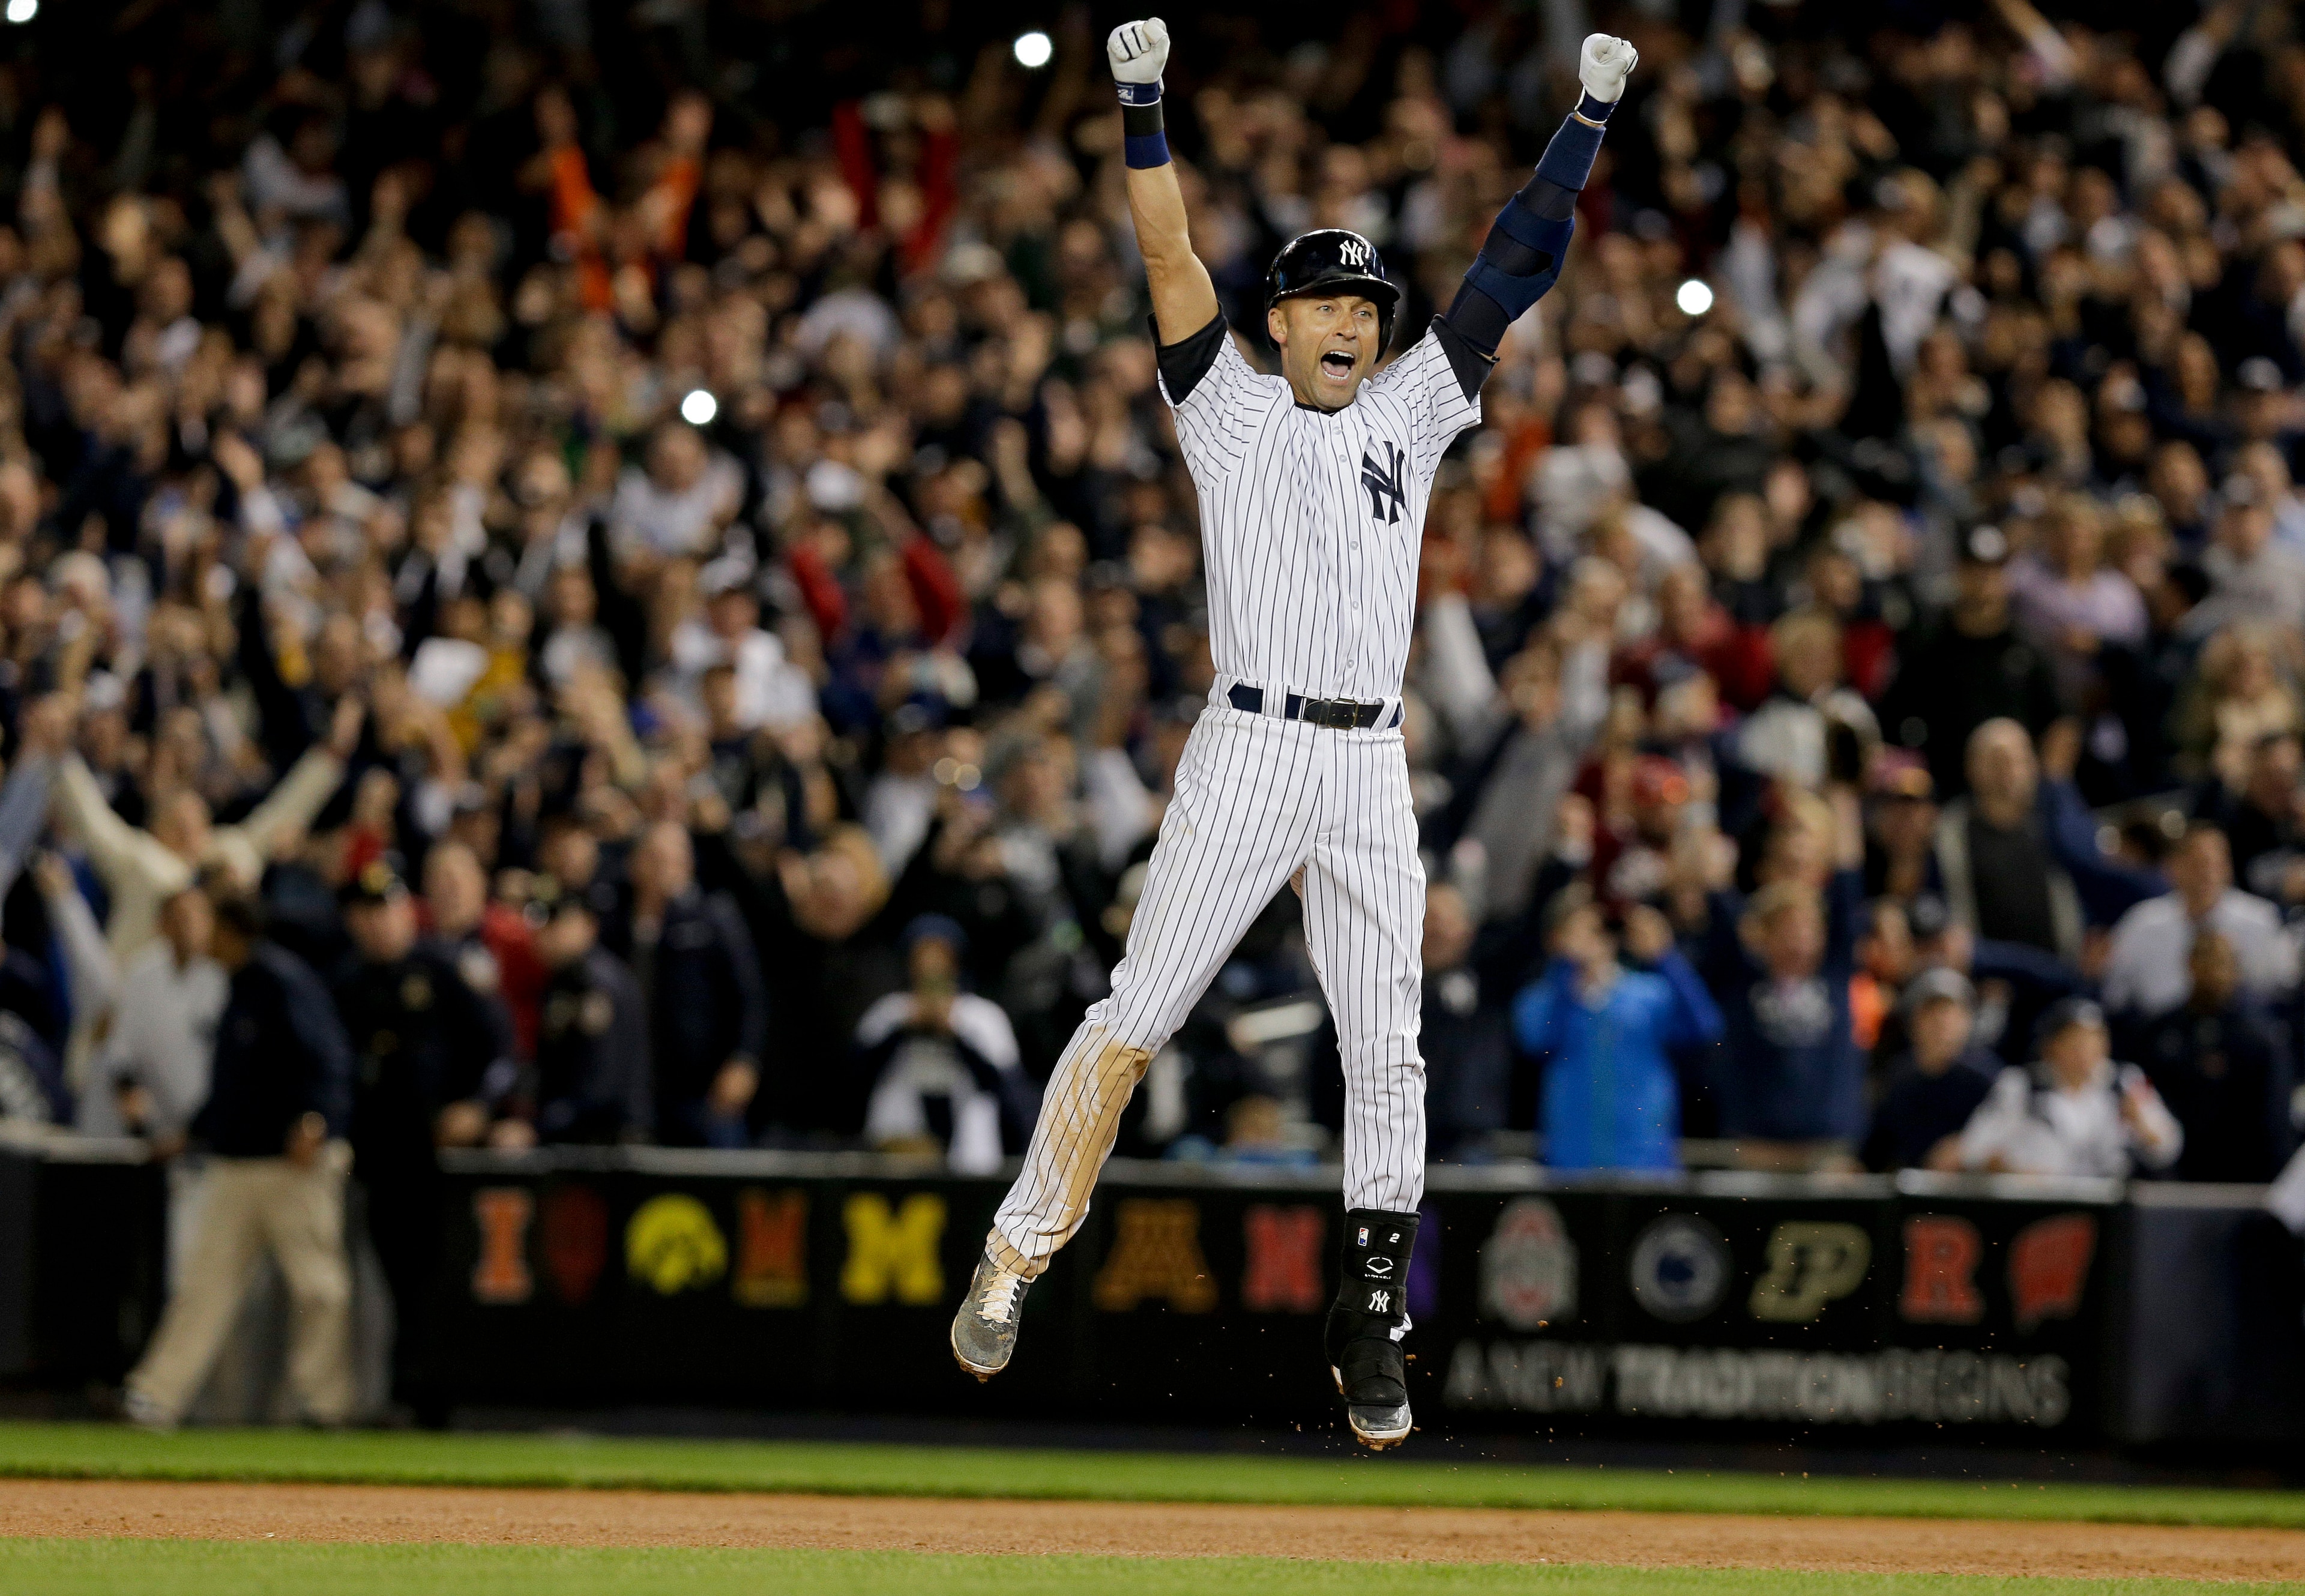
Years Active: 2000-2014
Key Statistics: 2,109 G, 9,716 PA, .307 AVG, .374 OBP, .432 SLUG, 197 HR, 272 SB
Total WAR: 48.4
Peak WAR Average: 5.2
Accolades: 12-time All-Star, five-time Gold Glove winner, five-time Silver Slugger, two-time World Series champion
Anyone whose first instinct is to associate Derek Jeter more so with the 1990s isn't wrong.
He arrived in 1995 and emerged as a generational talent between 1996 and 1999, when he hit .319/.391/.467 and helped to lead the New York Yankees to three World Series titles.
The bulk of Jeter's career, however, took place in the 2000s. And it was mostly business as usual.
Between 2000 and 2009, he carried on as a strong hitter (.317/.387/.456) mainly by doing his thing of hitting line drive after line drive to right field. He also hit .307/.379/.489 in the postseason during this stretch, which was bookended by his fourth and fifth World Series titles.
The big "Yeah, but" is that Jeter was a poor fit for the five Gold Gloves that were bestowed upon him during the 2000s. He could look the part of a defensive whiz—particularly when making his patented jump throws from the hole—yet he rates as the worst defender ever measured by defensive runs saved.
But if Jeter's defense was overrated, what's underrated is his baserunning. Overall, he checks in as one of the 10 most valuable baserunners of the century.
Alas, he was a shell of his former self by the time everyone was bidding him adieu in 2014. But he went out in style with a walk-off hit, thereby leaving everyone with a reminder of what they'd be missing.
Starting Third Baseman: Alex Rodriguez
5 of 14
Years Active: 2000-2016
Key Statistics: 2,142 G, 9,364 PA, .291 AVG, .385 OBP, .550 SLUG, 548 HR, 211 SB
Total WAR: 90.1
Peak WAR Average: 9.3
Accolades: Three-time American League MVP, 11-time All-Star, two-time Gold Glove winner, seven-time Silver Slugger, 2009 World Series champion
And now for the part where things get controversial.
Alex Rodriguez was never not a lightning rod during the 2000s. The former Mariner turned the city of Seattle against him when he bolted to the Texas Rangers for a $252 million payday in 2000, and then most of the country against him when he turned heel following a trade to the Yankees in 2004. Later came a series of performance-enhancing-drug scandals, including one that got him suspended for the entire 2014 season.
All this makes it hard not to cast an eye toward fellow third base star Adrian Beltre. He's put up nearly as much WAR (89.1) as A-Rod in the 2000s, and has done so while being nothing but a true professional.
But, here's a challenge: Just try and think of MLB in the 2000s without thinking about A-Rod.
The overall numbers he put up are staggering, and were most staggering when he was at the height of his powers between 2000 and 2007. His average season included a .305/.402/.593 slash line, 46 home runs and 8.3 WAR. He claimed five home run titles and three MVPs.
And while Rodriguez's many scandals do boggle the mind, not to be forgotten are his better moments.
He took one for the team when he joined the Yankees and moved to third base so that Jeter, an inferior defender, could stay at shortstop. In 2009, he returned from his first major PED scandal to will the Yankees to the World Series with a torrid October performance. Six years later, he returned from his yearlong PED suspension to play the good soldier in an all-around redemptive 2015 season.
So, seriously, try to think about 2000s baseball without A-Rod. It simply cannot be done.
Starting Left Fielder: Barry Bonds
6 of 14
Years Active: 2000-2007
Key Statistics: 986 G, 4,072 PA, .322 AVG, .517 OBP, .724 SLUG, 317 HR
Total WAR: 59.1
Peak WAR Average: 10.2
Accolades: Four-time National League MVP, six-time All-Star, five-time Silver Slugger
Elsewhere on the topic of controversial figures, there's Barry Bonds.
Like with Rodriguez, it's impossible to separate Bonds from the dark clouds that hung over his head during his 2000s playing days. Although it was Mark McGwire and Sammy Sosa who gave rise to the Steroid Era, it was Bonds who ultimately became the face of it. Whether he used them wittingly or unwittingly, steroids were a factor in his trek to his record-setting 762 career home runs.
But even if this knowledge brings pain, anger or some mix of both, this much can be said: For a time, Bonds was the very embodiment of hitting perfection.
Anyone who tuned in to watch him—and, let's face it, that was all of us—was treated to a hulking presence with a laser-guided eye for the strike zone and a lightning-quick bat that enabled him to easily crush pitches into dust. He owns nearly half (35 of 76) of all the balls that have ever been hit into McCovey Cove beyond right field at AT&T Park. He also hit one in the 2002 World Series that seemingly never landed.
What Bonds did with these talents between 2001 and 2004 might represent the most dominant stretch by any athlete, in any sport, at any time.
He set a single-season mark with 73 homers in '01, and averaged a .349/.559/.809 slash line and 52 home runs per season over those four years. His adjusted OPS+ was 156 points better than average. The next-best hitter in this span was 67 points better than average.
That will never happen again. Count on it.
Starting Center Fielder: Mike Trout
7 of 14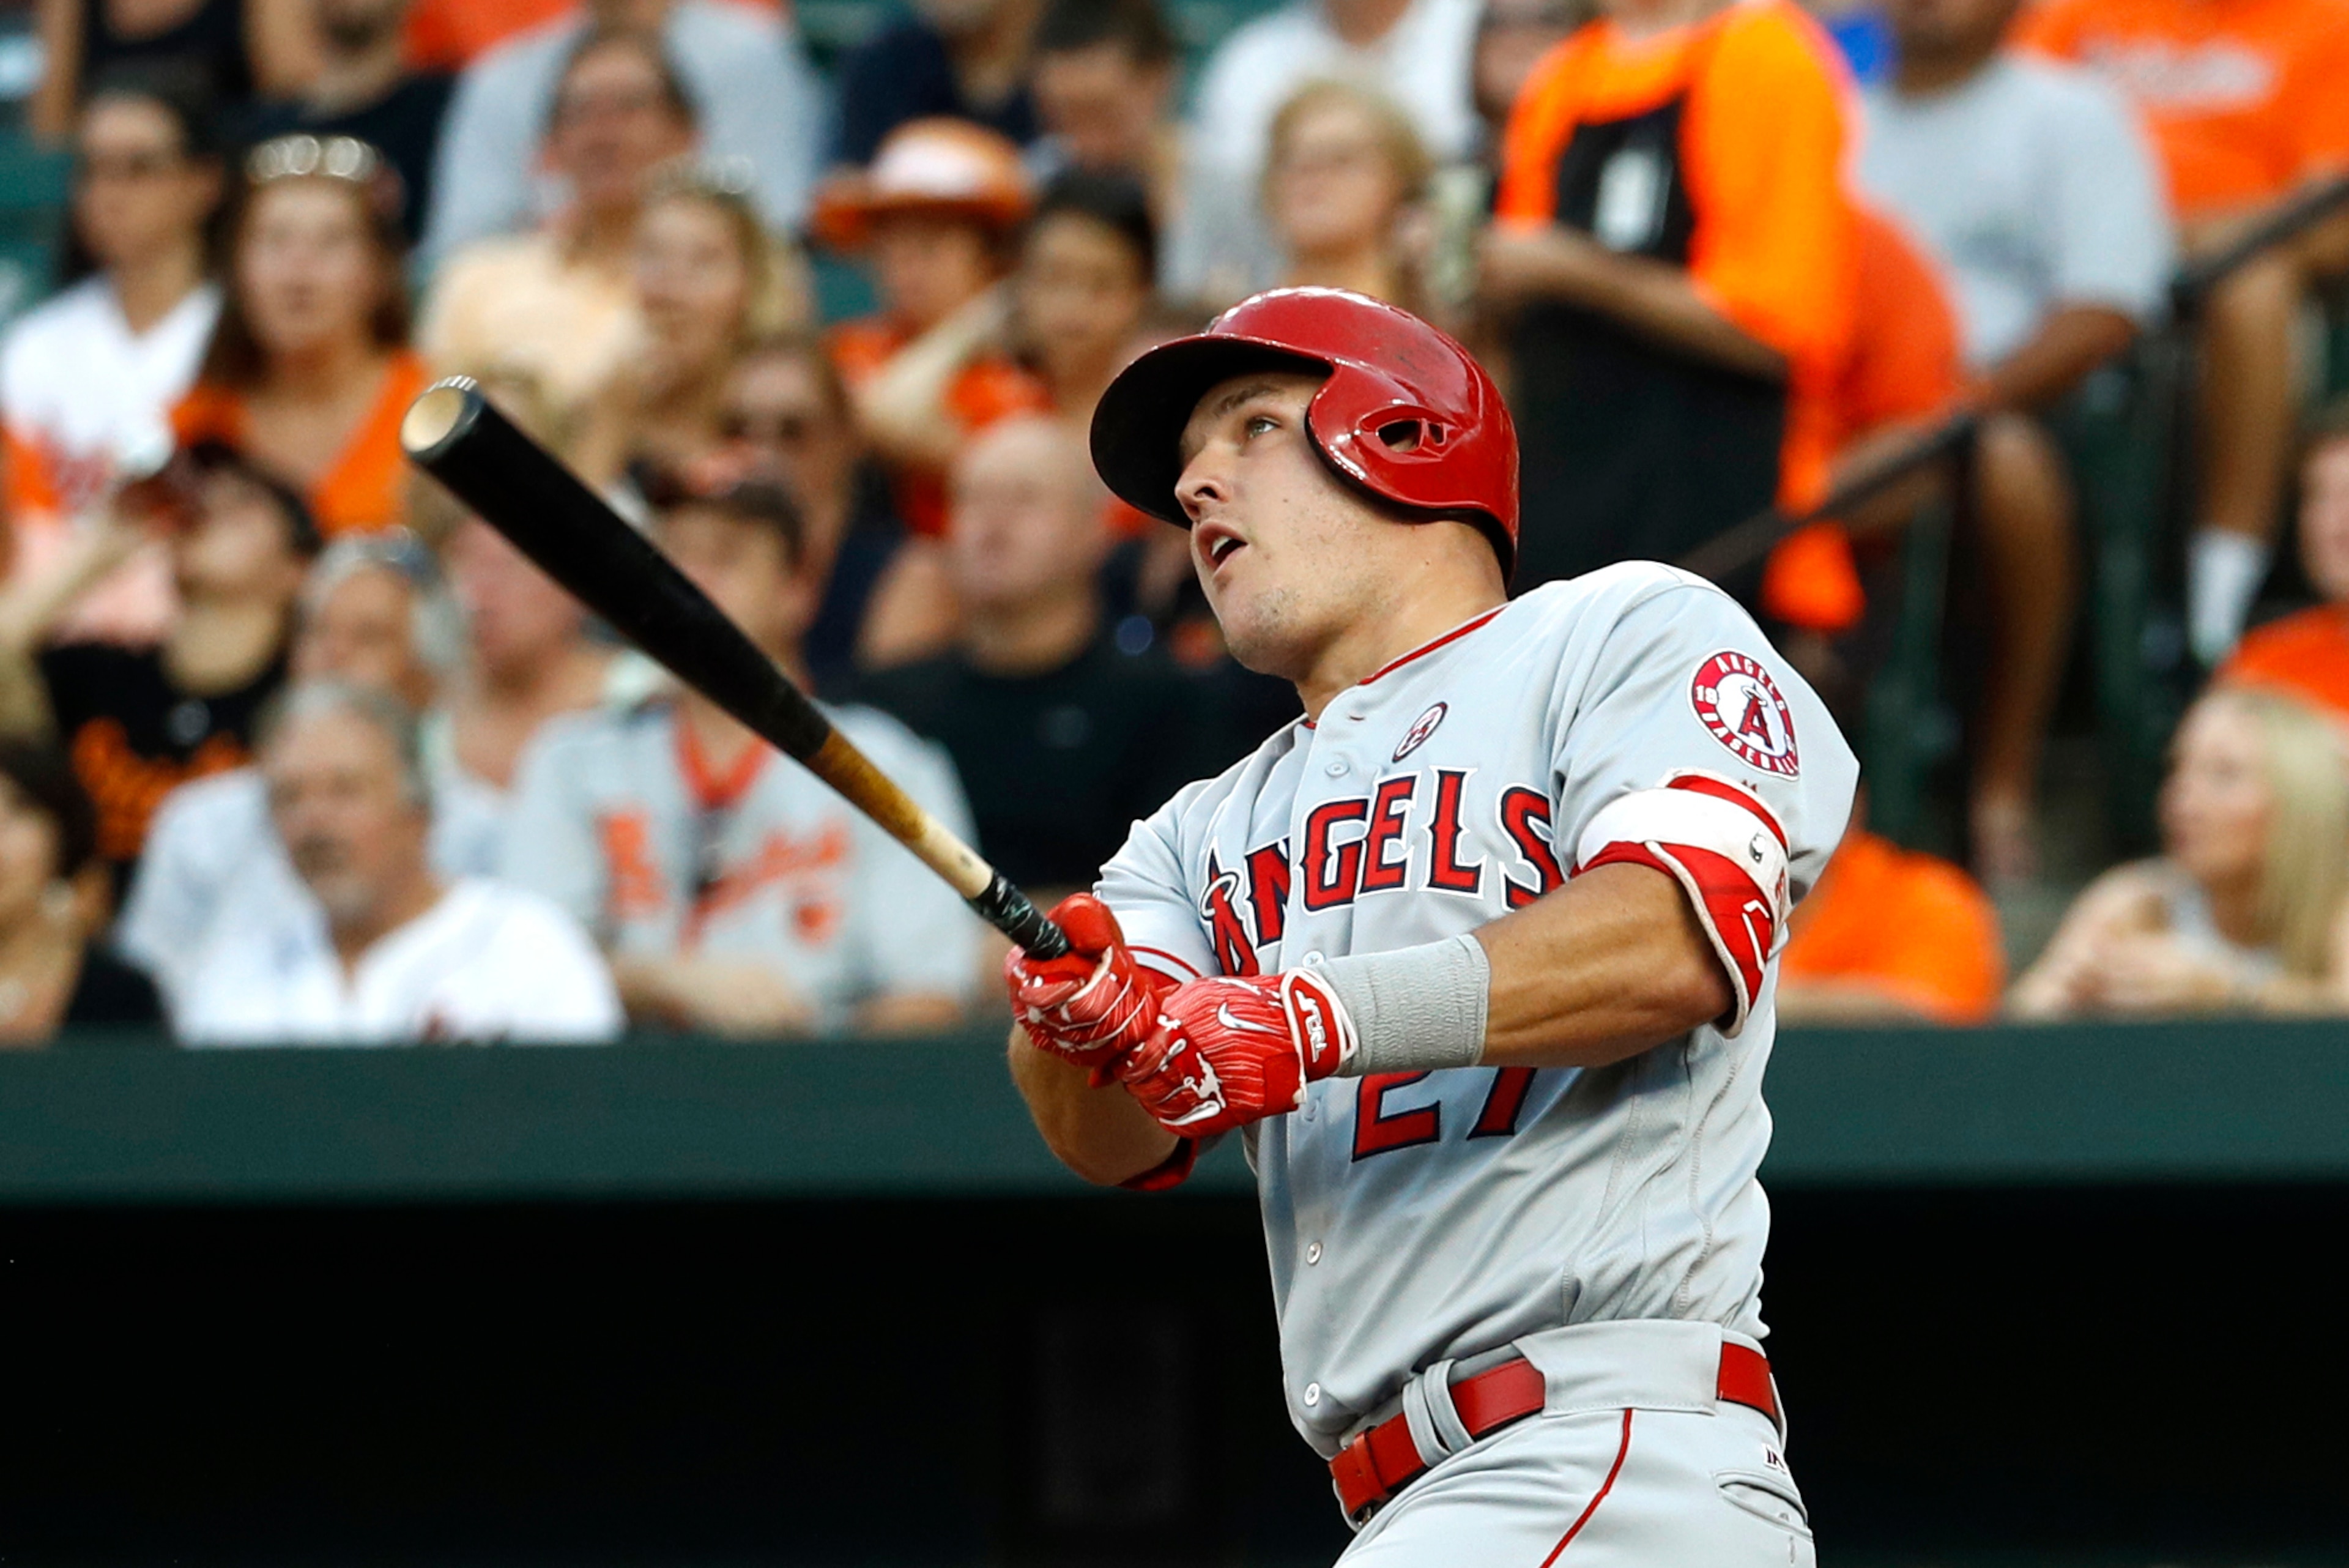
Years Active: 2011-2017
Key Statistics: 925 G, 4,065 PA, .306 AVG, .410 OBP, .566 SLUG, 201 HR, 165 SB
Total WAR: 55.2
Peak WAR Average: 9.6
Accolades: Two-time American League MVP, 2012 AL Rookie of the Year, six-time All-Star, five-time Silver Slugger
The full scope of Mike Trout's MLB legacy isn't yet perceivable. But so far, so great.
Although Trout debuted in 2011, he didn't truly arrive until he threw one of the greatest coming-out parties in baseball history in 2012. He put his impossible-seeming mix of power, speed and general baseball know-how to work in compiling a .326/.399/.564 slash line, 30 homers, 49 steals and 10.8 WAR. He was a relentless force on offense and a maker of ridiculous highlights on defense.
Trout's game has gone through some changes since then, with his power notably taking precedence over his speed. He's nonetheless continued to be nothing other than amazing, racking up a .306/.417/.574 slash line with 166 homers, 112 steals and 43.8 WAR since 2013.
All told, nobody is even close to Trout in overall WAR over the last six seasons. He ranks only 0.6 points behind Ty Cobb for the most WAR ever produced through the age of 25.
Take it from Jim Leyland, baseball's ultimate old-timer, that even old-timers can appreciate what they're seeing.
"I'm not a guy who likes to compare one player to another. I'm not going to compare Mike to anybody else," Leyland told Sports Illustrated's Ben Reiter last year. "But I will say this: People will try to compare other players to Mike Trout for a long time."
Starting Right Fielder: Ichiro Suzuki
8 of 14
Years Active: 2001-2017
Key Statistics: 2,636 G, 10,681 PA, .312 AVG, .355 OBP, .403 SLUG, 117 HR, 509 SB
Total WAR: 59.6
Peak WAR Average: 6.7
Accolades: 2001 American League MVP, 2001 AL Rookie of the Year, 10-time All-Star, 10-time Gold Glove winner, three-time Silver Slugger
With Bryce Harper, Giancarlo Stanton and Mookie Betts at the forefront, right field has become a star-studded position in recent years.
But for this honor, by far the most deserving member is perhaps the most famous baseball player of the 2000s: Ichiro Suzuki.
Even though he'd been a superstar in Nippon Professional Baseball, there wasn't a whole lot of fanfare in the states when Ichiro left Japan to join the Mariners in 2001. That changed overnight, as he wasted no time in treating stateside fans to his unique style of play en route to winning the AL Rookie of the Year and MVP.
Albeit with hitting mechanics that even "unorthodox" fails to accurately describe, Ichiro could hit any pitch in any direction he wanted. He mostly hit singles, but could use his speed to turn his singles into doubles and triples. His speed also served him well in the outfield, where his rocket arm was yet another weapon.
Ichiro hit over .300 every year between 2001 and 2010, peaking with a league-leading .372 average that helped produce a single-season record 262 hits in 2004. That was just one of seven seasons in which he led MLB in hits, and his 3,080 total hits since 2000 are easily the most of anyone.
The last seven years haven't been as kind to Ichiro, yet it's no small feat that he's continued playing into his mid-40s. An equally un-small feat, of course, is that his long career has allowed him to become arguably baseball's true all-time hit king.
Starting Designated Hitter: David Ortiz
9 of 14
Years Active: 2000-2016
Key Statistics: 2,297 G, 9,689 PA, .287 AVG, .380 OBP, .557 SLUG, 531 HR
Total WAR: 55.3
Peak WAR Average: 5.4
Accolades: 10-time All-Star, seven-time Silver Slugger, three-time World Series champion
How bad of a dude is David Ortiz?
Well, put it this way: He's dropped an F-bomb on live T.V. that even the Federal Communications Commission was cool with.
For a day job, Big Papi mainly spent the 2000s crushing home runs. He clubbed a total of 531 dingers, a fair percentage of which resulted in some of the most glorious bat flips ever.
Ortiz's mighty bat was instrumental in transforming the Boston Red Sox from cursed sad sacks to one of the most successful franchises of the 21st century. When it's said that he led the charge to World Series titles in 2004, 2007 and 2013, he really did lead the charge.
He wrapped up each of those three postseasons with an OPS over 1.200, and hit a mind-boggling .455/.576/.795 in 14 total World Series games. These are the crown jewels of a postseason legacy that has enough highlights in it for a four-minute video.
Like Rodriguez and Bonds, Ortiz does have ties to PEDs that can't be cut from his legacy entirely. It's comforting, however, that he was never actually punished for using banned substances. An even bigger comfort is how much of his 2000s excellence took place during the post-2005 testing era, when he slashed .289/.388/.565 and hit 411 of his 541 career home runs.
It all culminated in a .315/.401/.620 slash line and 38 home runs in his final season in 2016. With that, the top designated hitter of the 2000s left baseball with the best farewell season ever.
The Bench: Posey, Cabrera, Utley, Beltran
10 of 14
Backup Catcher: Buster Posey
37.5 Total WAR, 5.7 Peak WAR Average
Although he can't match Joe Mauer's longevity, it was remarkably difficult to deny Buster Posey the starting catcher position based on the strength of his prime.
He's been a Rookie of the Year, an MVP and (albeit with unspectacular postseason numbers) a three-time World Series champion since 2010. In this eight-year span, he's leveraged his excellent all-around skills into 10.4 more WAR than any other catcher.
Backup Corner Infielder: Miguel Cabrera
68.8 Total WAR, 6.9 Peak WAR Average
If this exercise revolved entirely around WAR, Adrian Beltre would be a shoo-in for this spot. But knowing how much his WAR is dependent on the accuracy of defensive metrics, it's difficult to elevate him over a guy who's legitimately one of the best hitters ever and one of the most decorated superstars in recent memory.
Miguel Cabrera has spent the bulk of his 15-year career smashing baseballs into tiny shreds. His .317 batting average is the best of any active player, and his 151 OPS+ is 19th-best of all hitters who've logged over 9,000 plate appearances. His skills have earned him 11 All-Star nods, two MVPs, a World Series ring, four batting titles, two home run titles and an ultra-rare triple crown. Not too shabby.
Backup Middle Infielder: Chase Utley
65.4 Total WAR, 7.9 Peak WAR Average
If it seems shocking that Chase Utley ranks second to Robinson Cano in total WAR among middle infielders during the 2000s, the trick is to remember just how absurdly great he was in his prime.
Between 2005 and 2009, Utley slashed .301/.388/.535 with an average of 29 homers and 15 stolen bases per season, also clubbing seven homers in only 49 World Series plate appearances. He might have also been the best defender in the league. Even after this stretch was completed, he continued to average 4.0 WAR per year between 2010 and 2014.
Backup Outfielder: Carlos Beltran
64.8 Total WAR, 6.6 Peak WAR Average
Mike Trout's prime and influence on baseball in the 2010s are too great to brush aside. Otherwise, it would have been easy to hand the starting center field job to Carlos Beltran.
He owns more WAR than any other outfielder in the 2000s. That's a testament to a glove that was golden and legs that were quick early in the decade, as well as to a bat that remained dangerous long after those attributes left him. He was a solid .278/.352/.489 hitter in the regular season, and an otherworldly .307/.412/.609 hitter in the postseason.
Painful Omissions: Adrian Beltre, Chipper Jones, Vladimir Guerrero, Todd Helton, Joey Votto, Scott Rolen, Yadier Molina, Troy Tulowitzki
Staff Ace: Roy Halladay
11 of 14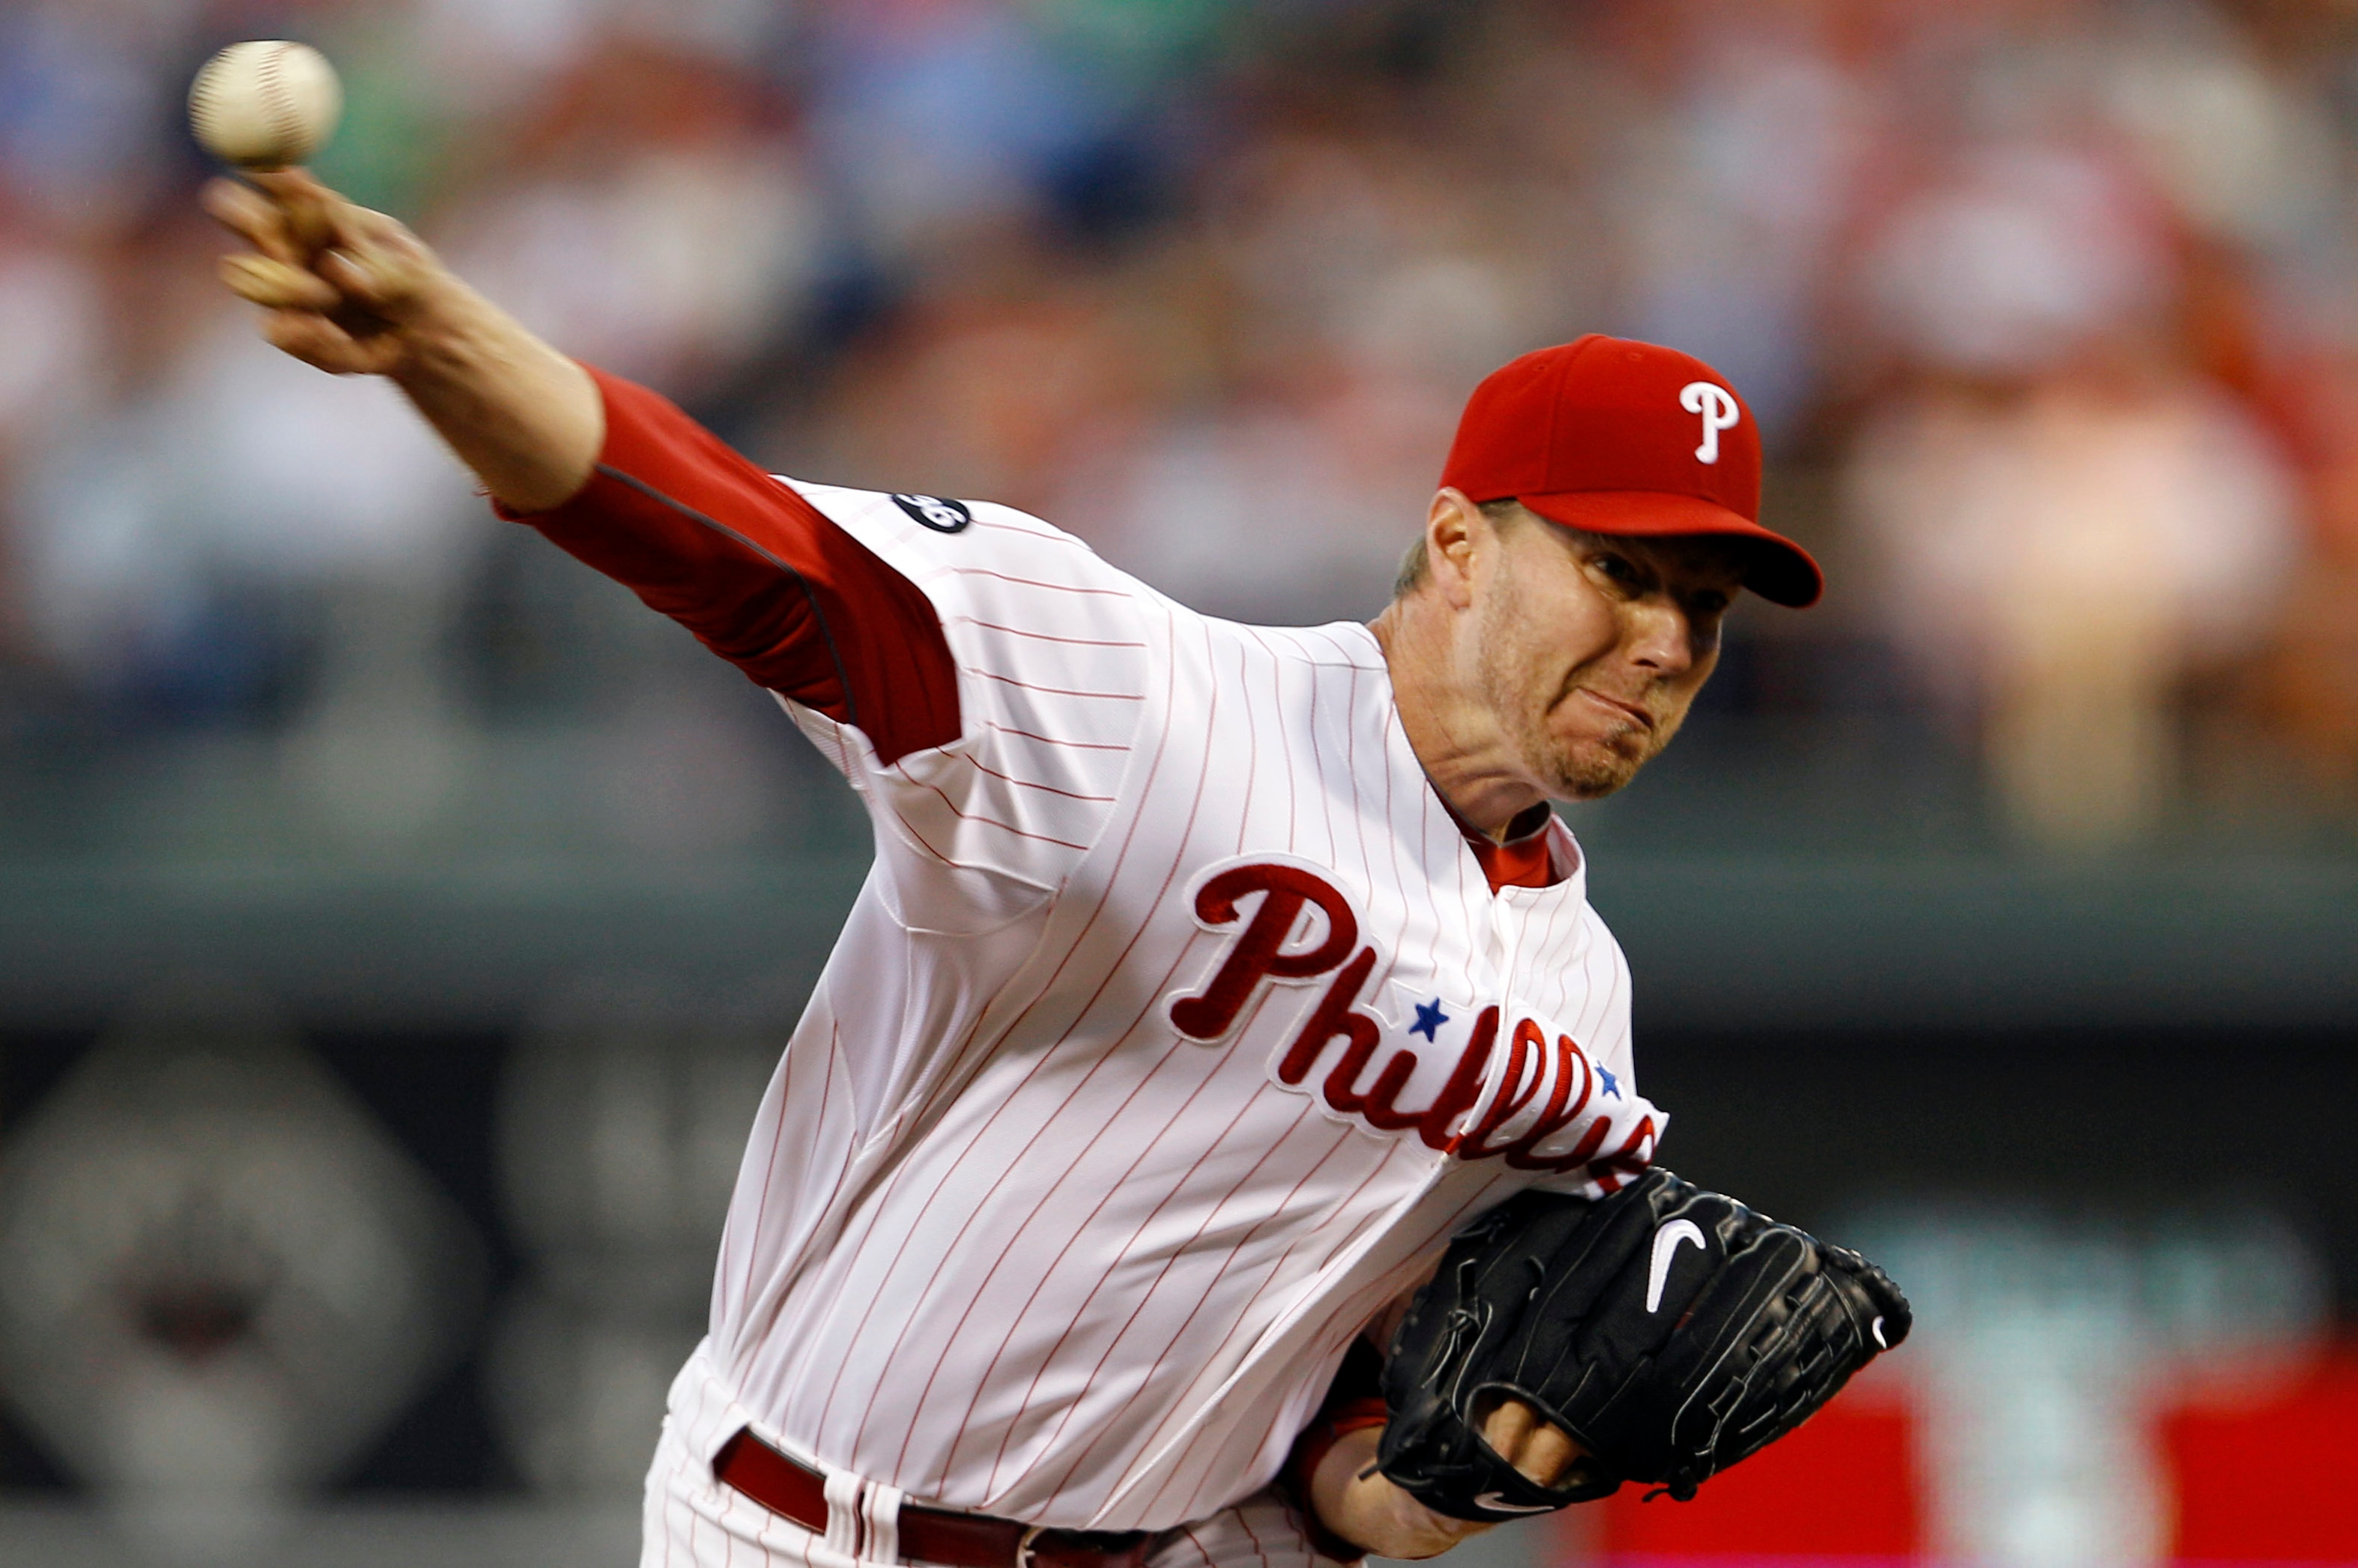
Years Active: 2000-2013
Key Statistics: 370 GS, 2,586 IP, 7.0 K/9, 1.8 BB/9, 3.36 ERA
Total WAR: 62.6
Peak WAR Average: 7.9
Accolades: Two-time Cy Young Award winner, eight-time All-Star
This is not merely an honorary title for the dearly departed Roy "Doc" Halladay.
Even though he didn't establish himself as an ace until 2002 and was done as one by 2011, he still accumulated more WAR than any other pitcher has since the turn of the century. He often hit remarkable heights, notably producing more eight-WAR seasons (three) than all but one other starter.
This reflects how excellent Halladay was during his 2002-2011 heyday. He was a man out of time as a workhorse, averaging 219 innings per season and climbing as high as 266 innings in 2003 and 250.2 innings in 2010. And with a 2.97 ERA in this span, his durability came with dominance to match.
Watching Halladay pitch was the baseball equivalent of watching Michelangelo paint. He had low-to-mid-90s velocity at his peak, but overwhelmed batters more with his ability to do whatever he damn pleased with the ball. He could throw to any spot, with any movement and any speed.
"You can't go up there thinking you're going to take some pitches and work the count, because you'll be 0 and 2 before you know it," Derek Jeter told Tom Verducci of Sports Illustrated in 2010. "And you know you can't run up his pitch count to get him out early. His command is too good, and he never comes out."
Never did Halladay have it working better than on May 29, 2010, when he tossed the 20th perfect game in MLB history. Unless, of course, you prefer Oct. 6, 2010, when he threw only the second no-hitter in MLB postseason history.
In any case, the memories go on and on. Thanks for leaving them, Doc.
Starters 2-5: Kershaw, Johnson, Sabathia, Verlander
12 of 14
No. 2: Clayton Kershaw
57.4 Total WAR, 7.1 Peak WAR Average
Clayton Kershaw matches neither (unsurprisingly) Halladay's longevity nor (surprisingly) his peak. But if the question is who's the single most dominant pitcher of the 21st century, Kershaw has earned his spot on the tip of everyone's tongue.
His curveball has buckled countless knees, and his personal list of accomplishments includes three Cy Young Awards, an MVP, five ERA titles and three strikeout titles. His 2.36 ERA is by far the lowest of any active pitcher. His adjusted ERA+ of 161, meanwhile, is the best. Of any pitcher. Ever.
No. 3: Randy Johnson
51.5 Total WAR, 8.6 Peak WAR Average
Randy Johnson kicked off the 21st century by winning three straight National League Cy Young awards between 2000 and 2002. In that span, he averaged a 2.48 ERA over 253 innings and struck out 835 more batters than he walked. The span also contains a dominant 2001 postseason that culminated in him sharing World Series MVP honors with Curt Schilling.
The Big Unit followed an injury-marred 2003 with a return to excellence in 2004, peaking in a perfect game and resulting in yet another strikeout title. He then remained mostly useful for five more years before calling it a career and heading to the Hall of Fame.
No. 4: CC Sabathia
60.7 Total WAR, 5.9 Peak WAR Average
Fun fact: While Baseball-Reference.com's WAR is the go-to in these parts, CC Sabathia is the pitching WAR leader of the 2000s over at FanGraphs.
The big lefty was more of an innings-eater than a great pitcher early in his career. That started to change in 2006, when he married strong command with his hard fastball/slider combination. From there through 2012, he averaged a 3.14 ERA and 227 innings per season and proved himself as a clutch performer during the Milwaukee Brewers' 2008 stretch run and the Yankees' quest to the 2009 World Series title.
No. 5: Justin Verlander
56.9 Total WAR, 6.6 Peak WAR Average
This last slot is a tough call between Justin Verlander and Zack Greinke, the latter of whom boasts impressive longevity and heights that, apart from him, only Johnson and Pedro Martinez have explored this century.
But between the two, it's harder to imagine the 2000s pitching landscape without Verlander.
He's averaged a 3.45 ERA and 211 innings since 2006, along the way picking up an ERA title, four strikeout titles and a handful of shiny trinkets: Rookie of the Year, Cy Young, MVP and, most recently, a World Series ring. And since his fastball is more ageless than he'd previously led everyone to believe, it's apparent that he's going to keep going like this for a while.
Most Painful Omissions: Zack Greinke, Max Scherzer, Pedro Martinez, Johan Santana, Felix Hernandez, Tim Lincecum, Mark Buehrle, Tim Hudson, Cole Hamels, Roy Oswalt, Cliff Lee
The Closer: Mariano Rivera
13 of 14
Years Active: 2000-2013
Key Statistics: 849 G, 907 IP, 8.3 K/9, 1.7 BB/9, 2.05 ERA
Total WAR: 41.4
Peak WAR Average: 4.0
Accolades: 11-time All-Star, 2-time World Series champion
Surprise. The greatest relief pitcher ever is also the greatest of the 2000s.
Mariano Rivera arose as a dominant late-inning arm in 1996, when he and John Wetteland formed the backbone of a bullpen that was instrumental in the Yankees winning the World Series. He started closing games in 1997 and, as they say, never looked back.
No other reliever even comes close to Rivera's 41.4 WAR in the 2000s. As a rule, relievers burn fast and bright. He burned long and bright by averaging 61 appearances and a 2.05 ERA over 14 years. He also put up a 0.86 ERA in 65 postseason appearances in helping to lock up two World Series titles in the 2000s.
Mind you, ERA isn't the best dominance measuring stick for relievers. But what should suffice as an alternative is the 43 adjusted OPS+ that Rivera held hitters to. That's tied for third-lowest during the 2000s, but is by far the best if the workload bar is raised to a minimum of his 907 innings.
Doing the deed for Rivera year in and year out was, of course, his cutter. Its speed diminished over the years, but that did little to dampen its filthy movement. Hitters always knew it was coming, and it never mattered.
The Bullpen: Nathan, Papelbon, Kimbrel, Wagner, Rodriguez, Chapman
14 of 14
Setup: Joe Nathan
25.3 Total WAR, 3.3 Peak WAR Average
Perhaps the ultimate compliment that can be paid to Joe Nathan is that he came the closest to being on Mariano Rivera's level in the 2000s. He did the bulk of his work between 2004 and 2013, in which he used his fastball/slider combination to carve out a 2.14 ERA and hold hitters to a 59 OPS+.
Setup: Jonathan Papelbon
23.7 Total WAR, 3.3 Peak WAR Average
The Red Sox tabbed Keith Foulke as their closer going into the 2006 season, only to pull the ol' switcharoo and insert Jonathan Papelbon early into the year. Between then and 2014, the firebrand righty rode his sharp command and explosive fastball to a 2.35 ERA and 4.7 strikeout-to-walk ratio. He also allowed runs in just one of his 18 postseason appearances and picked up a World Series ring in 2007.
Setup: Craig Kimbrel
18.0 Total WAR, 3.0 Peak WAR Average
Craig Kimbrel hasn't been at it for too long, yet his sheer dominance is already good enough for the record books. With his unhittable fastball and breaking ball, he's struck out an MLB-record 42 percent of the batters he's faced. He's also held batters to a 33 OPS+, the lowest of the 2000s.
Middle Relief: Francisco Rodriguez
24.0 Total WAR, 2.8 Peak WAR Average
Francisco Rodriguez turned heads as an out-of-nowhere whippersnapper with a mid-90s heater and a physics-defying breaking ball during the Anaheim Angels' 2002 World Series run. He went on to put up a 2.38 ERA over 403 appearances between 2003 and 2008, and he posted a single-season record 62 saves in 2008. He's slowed down since then, but it reflects well on him that only two of his seasons (2012 and 2017) qualify as truly bad.
Middle Relief: Billy Wagner
20.0 Total WAR, 2.7 Peak WAR Average
Billy Wagner started making a name for himself in the 1990s before flopping hard at the outset of the new millennium in an injury-marred 2000 season. Between 2001 and 2010, however, he was good for a 2.13 ERA in 60 appearances per year, in which his blistering fastball helped him strike out an MLB-best 31.6 percent of the batters he faced.
Middle Relief: Aroldis Chapman
14.4 Total WAR, 2.5 Peak WAR Average
If nothing else, Aroldis Chapman is deserving of historical significance simply by throwing enough triple-digit fastballs for MLB.com to include a "Chapman Filter" in its Statcast search engine. But he also gets credit for putting his heat to good use. He's the guy immediately behind Kimbrel in career strikeout rate (41.4) and in OPS+ allowed (41) in the 2000s.
Most Painful Omissions: Kenley Jansen, David Robertson, Keith Foulke, Joakim Soria, LaTroy Hawkins
Stats courtesy of Baseball-Reference.com and FanGraphs.


_0.png?w=3840 "Summer League Takeaways ✍️")


.jpg?w=3840 "Watch: Jerry Rice Chases After Heckler")


.png?w=3840 "Offseason Moves Sure To Backfire 💥")
