An Idiot's Guide to Football Stats Every NFL Fan Must Know
Idiot's guide, huh? Well, I don't know if that's directed at me, but on occasion my wife says I fit the bill so I guess it works.
If I must play the role, then here we go.
It's quiet now, so you're not thinking about it, but on Sundays during football season you get bombarded with an endless stream of random stats. They fly by, almost too fast for you to actually do more than absorb them and move on and it's tough to know whether or not they really mean much of anything.
TOP NEWS
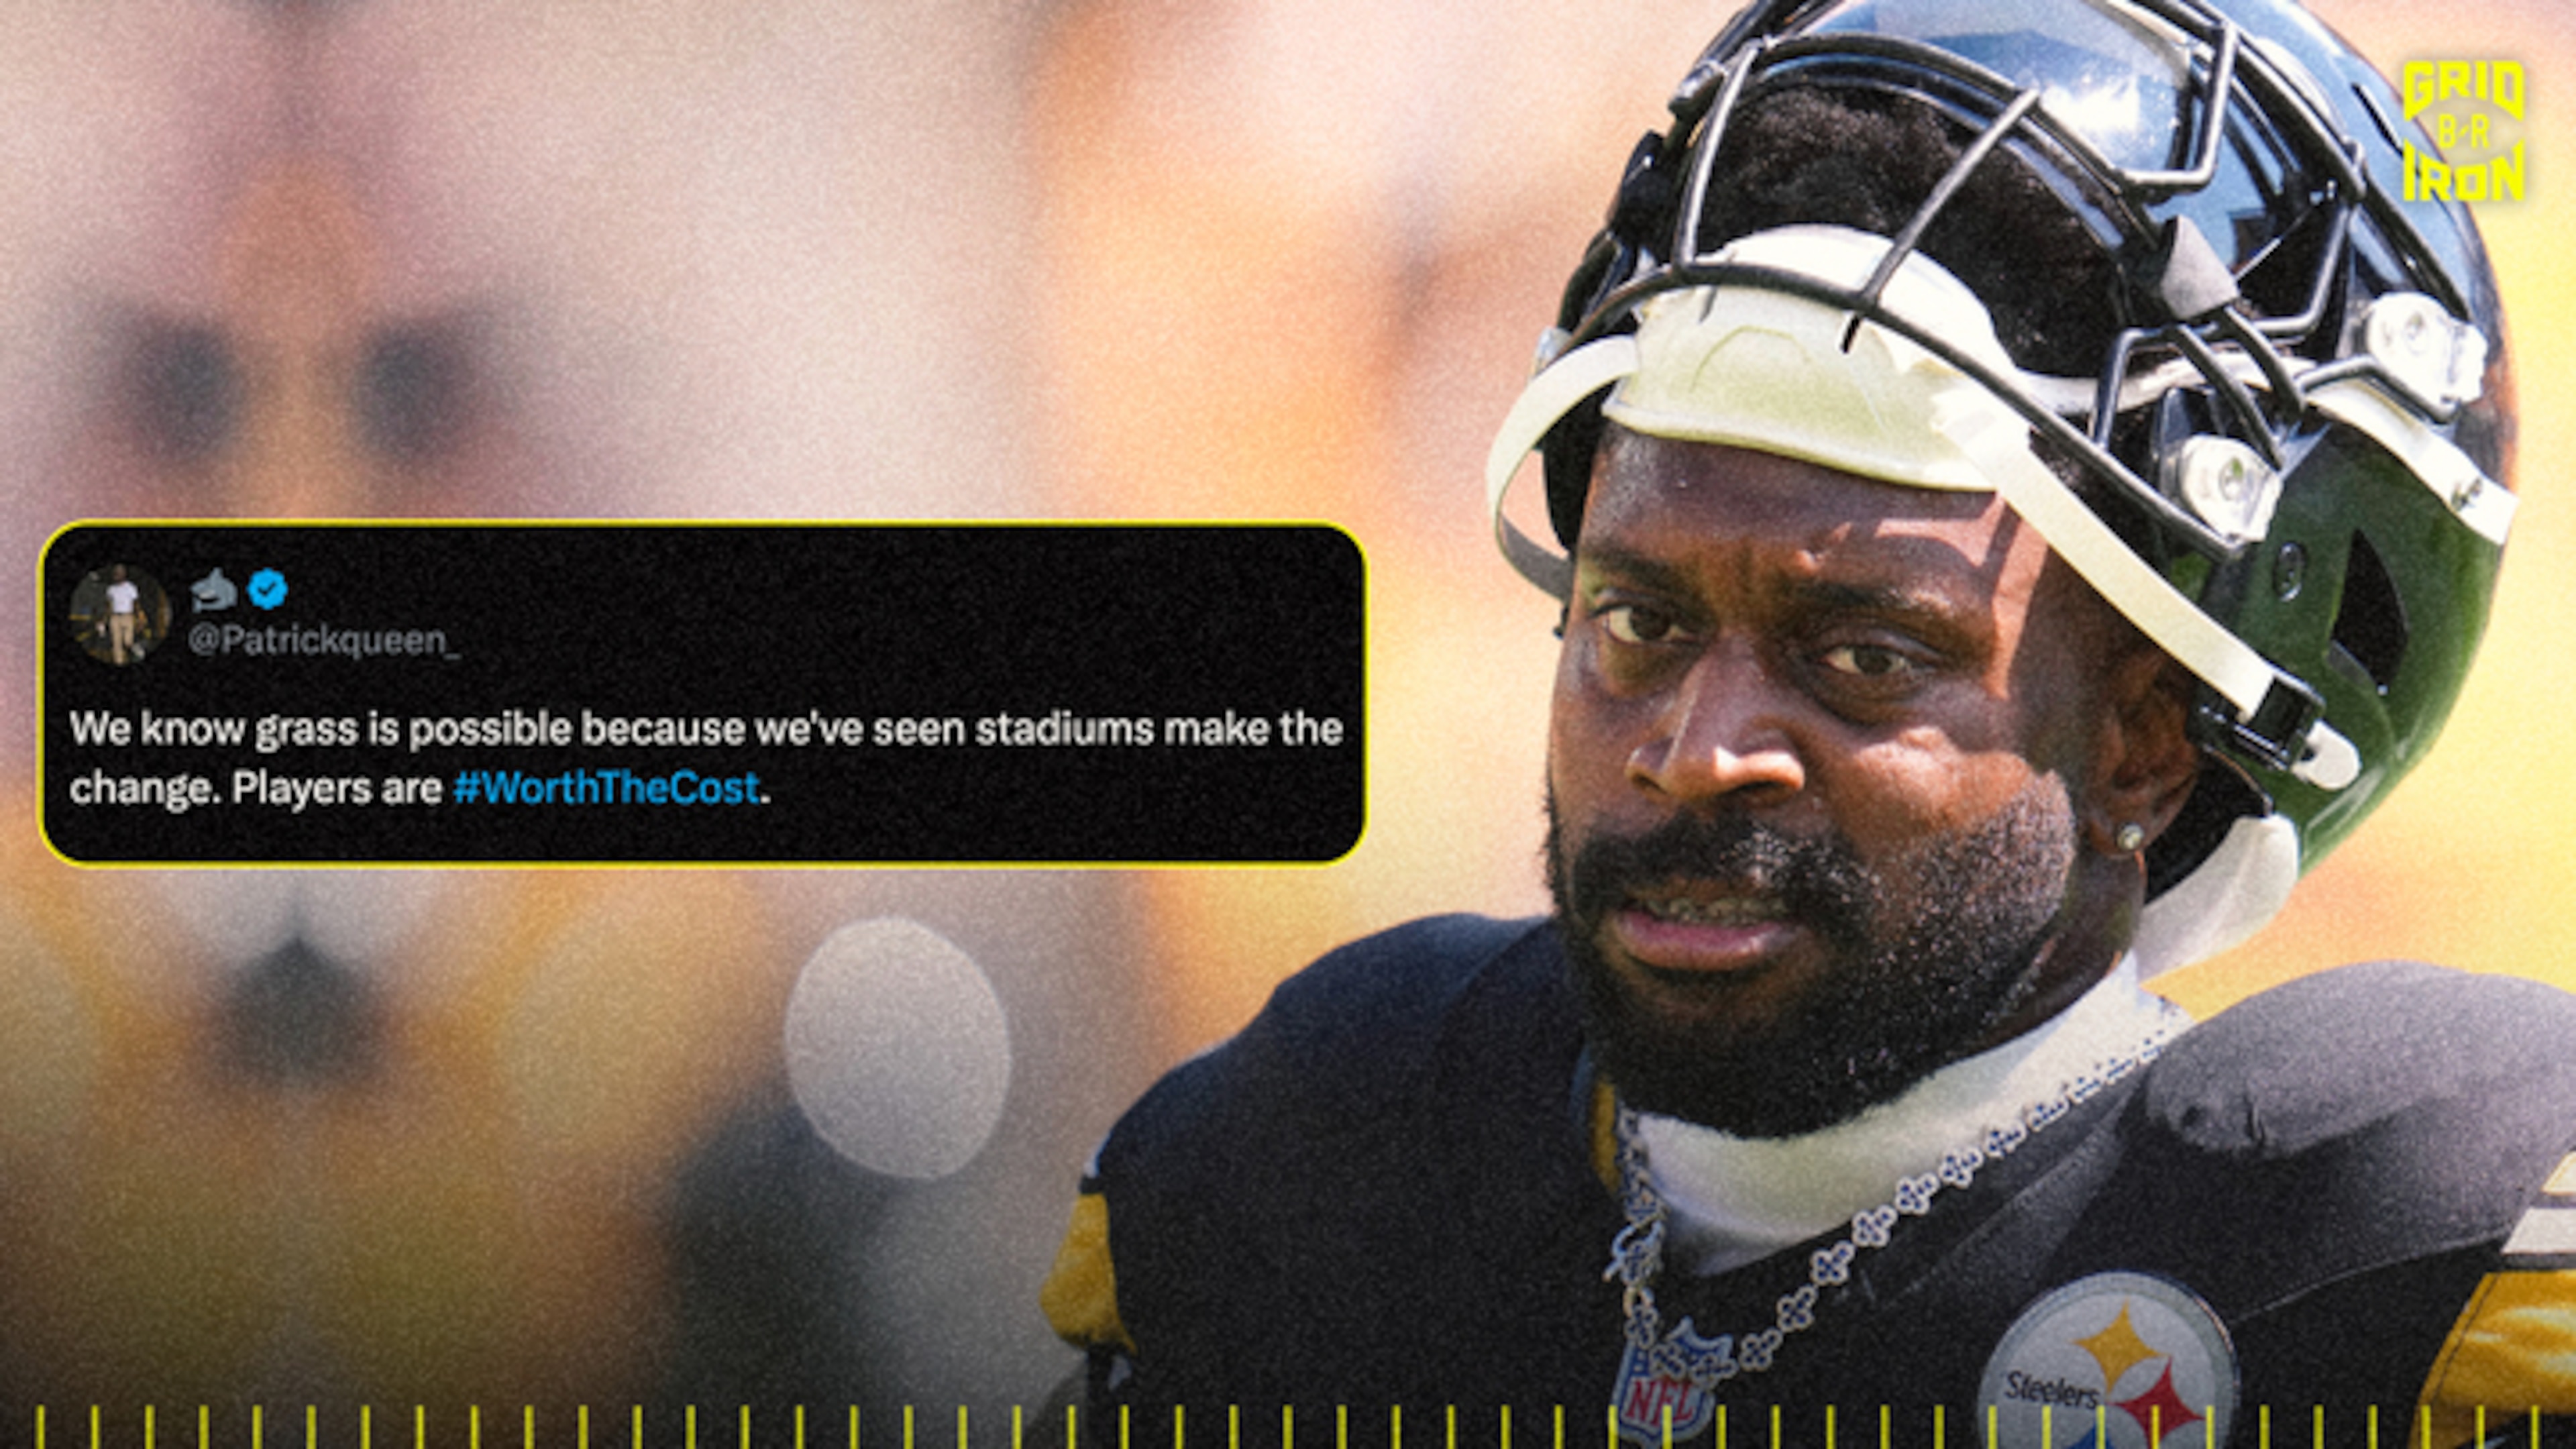
NFL Players Unite to Ban Turf
NFL Suspends Cardinals Executive Indefinitely (AP)

Expectations for 2nd-Year NFL QBs 🧐
However, in all the chatter and chaff there are some stats that are worth knowing about.
With that in mind, here are my five which should make your ears perk up when you hear them talked about.
Passer Rating vs. Total QB Rating
Just before the NFL kicked off its season in 2011, ESPN decided that the NFL passer rating which had been used for years was inadequate and attempted to change the conversation with their own formula called the total quarterback rating.
It turned out to be a bit of a mixed bag. How else can you describe a system which ranks Tim Tebow ahead of Aaron Rodgers when Rodgers went 26-of-39 for 396 yards and a pair of touchdowns in a win while Tebow was 4-of-10 for an epic 79 yards and a touchdown? Oh, the Broncos lost that game.
(Tebow did run for another touchdown.)
There's a flaw there.
In essence neither one is perfect. In the old passer rating the NFL uses a formula including completion percentage, average yards per attempt, percentage of touchdown passes and percentage of interceptions.
The math makes my head hurt but this is a method that is heavy on statistics and combines the average of the above four categories, divide that total by six and then multiply it by 100.
The biggest flaw in this system is that a 30-yard touchdown at the start of a game weighs the same as a 30-yard touchdown in crunch time and an interception under pressure on a game-ending drive is the same as one which is a Hail Mary at the end of the half.
Total QBR tries to change that, weighing game situation as well as the outcome and what it meant for a game.
Dean Oliver, the Director of Analytics and ESPN Stats and Information explained it this way when ESPN launched their foray into hard stats:
"The Total Quarterback Rating is a statistical measure that incorporates the contexts and details of those throws and what they mean for wins. It's built from the team level down to the quarterback, where we understand first what each play means to the team, then give credit to the quarterback for what happened on that play based on what he contributed.
"
Sounds reasonable to me.
Until you look back at that Tebow/Rodgers week and it all gets blown apart. Context is great and a game-winning TD pass for three yards is more vital than a garbage time 40-yard bomb. That said, you can't argue to me that Tebow had a better day on 79 yards and a pair of touchdowns in a loss. It just doesn't compute. There's context and there's context.
Honestly, there has to be a happy medium here but so far neither side will budge.
Until then, this is a statistical category which will see the light of day every Sunday and anyone who loves football has to know what they mean—even if we don't agree on what that is.
Yards Per Carry
I think this—more than touchdowns, more than long runs—represents how well a running back is doing his job. Now, some of this is dependent upon outside factors—offensive line play, rookie quarterbacks the defense doesn't respect and injury to name a few. However, ultimately an effective running back is one who gets a good chunk of average yards every carry.
Strictly speaking, a good running back should be hovering no lower than 4.0 yards per carry. If your favorite team has a back lower than that, expect trouble. At some point that will catch up to a team.
If you look at the top running backs in any given year, most of the time they'll be over 4.5 yards per carry and the truly elite backs will be up and around 5.0.
Simply put, what this means is a back is getting positive yards on every carry. Some will be longer than others, but they are gaining a good chunk of yards every carry.
You want to watch how a back is doing throughout a game and what he is averaging will give you a sense of how effective he is and how he might be helping or hindering your team.
Pressured Performance
The key to any successful team is a quarterback who can perform under duress. Not even necessarily perform well, though that is critical to a good quarterback, but to at least not fall apart.
ProFootballFocus.com had an interesting article this past January about how quarterbacks perform under pressure.
If Mark Sanchez had read it, he might not be shocked he's fighting off someone for his starting job.
In short, the article takes the percentage quarterbacks under pressure avoid sacks, the ratio of touchdowns to interceptions when feeling pressure, the amount of completions when under pressure and then combine them to determine an overall "pressure" grade for quarterbacks.
The New York QBs bookended the list this year, much to Jets fans consternation.
How a quarterback responds under pressure is critical to a team's success. As I said, it's not even the ability to score touchdowns but to avoid mistakes and turnovers as well.
Dropped Passes
Part of the problem with any quarterback rating system is that they often don't take into account receiver mistakes which is to say, when a receiver blows a route or drops a ball it tends to reflect badly on the quarterback's stats.
To be fair, it cuts the other way sometimes as well. Receivers get an incomplete pass mark for a ball thrown out of bounds 10 feet above their heads.
The dropped passes are the stat I track the most as it is a good indication of when a quarterback-receiver pairing is gelling and when it isn't.
Once again I point to the boys at Pro Football Focus (though Football Outsiders does great work here as well) and their last drop rate article.
As they say themselves, the formula isn't perfect. Like passer rating, it doesn't always account for how critical a drop is. It's still very useful though and you can see some receivers' drop rates reflect an overall poor season—most notably DeSean Jackson. The exception to the rule this year was Roddy White but even his 15 drops come in part due to a high volume of targets.
Offensive Line Rankings
When it comes to stats, offensive line is the hardest to track. Ask anyone who watches games closely and they'll admit that grading and analyzing offensive line play is very tough. Why?
Well you never know what assignments were, nor assignments which might have been blown by someone else. That's just the tip of the iceburg as well.
So individual stats are tough to do accurately. However, overall line stats are a little easier and I like the ones NFL.com puts up every week.
How lines do in run blocking, both left and right as well as how many sacks and overall hits on the quarterback they allow will give you a good idea of how a line is faring. Of course, it can be easy to get seduced by the numbers over the course of a season and once you are in Week 10 or 12, moving percentages can be tough even if the line is improved.
Still, keeping an eye on the rankings is a good way to get a sense of who is effective and who is not.

.jpg?w=3840 "Ravens Football")


