Washington Redskins Key Stats Tracker (Preseason Final)
 Welcome to the fourth and final preseason installment of the 2010 Washington Redskins' Key Stats Tracker.
This is a weekly feature we will run all season, focusing on three specific statistical categories—turnover differential, third-down-efficiency, and red-zone-efficiency—plus any specific observations/anomalies that stand out from any given game.
This week, we look at the Redskins 20-10 loss to the Arizona Cardinals, and tie a bow on the 2010 preseason.
Thank god.
TOP NEWS
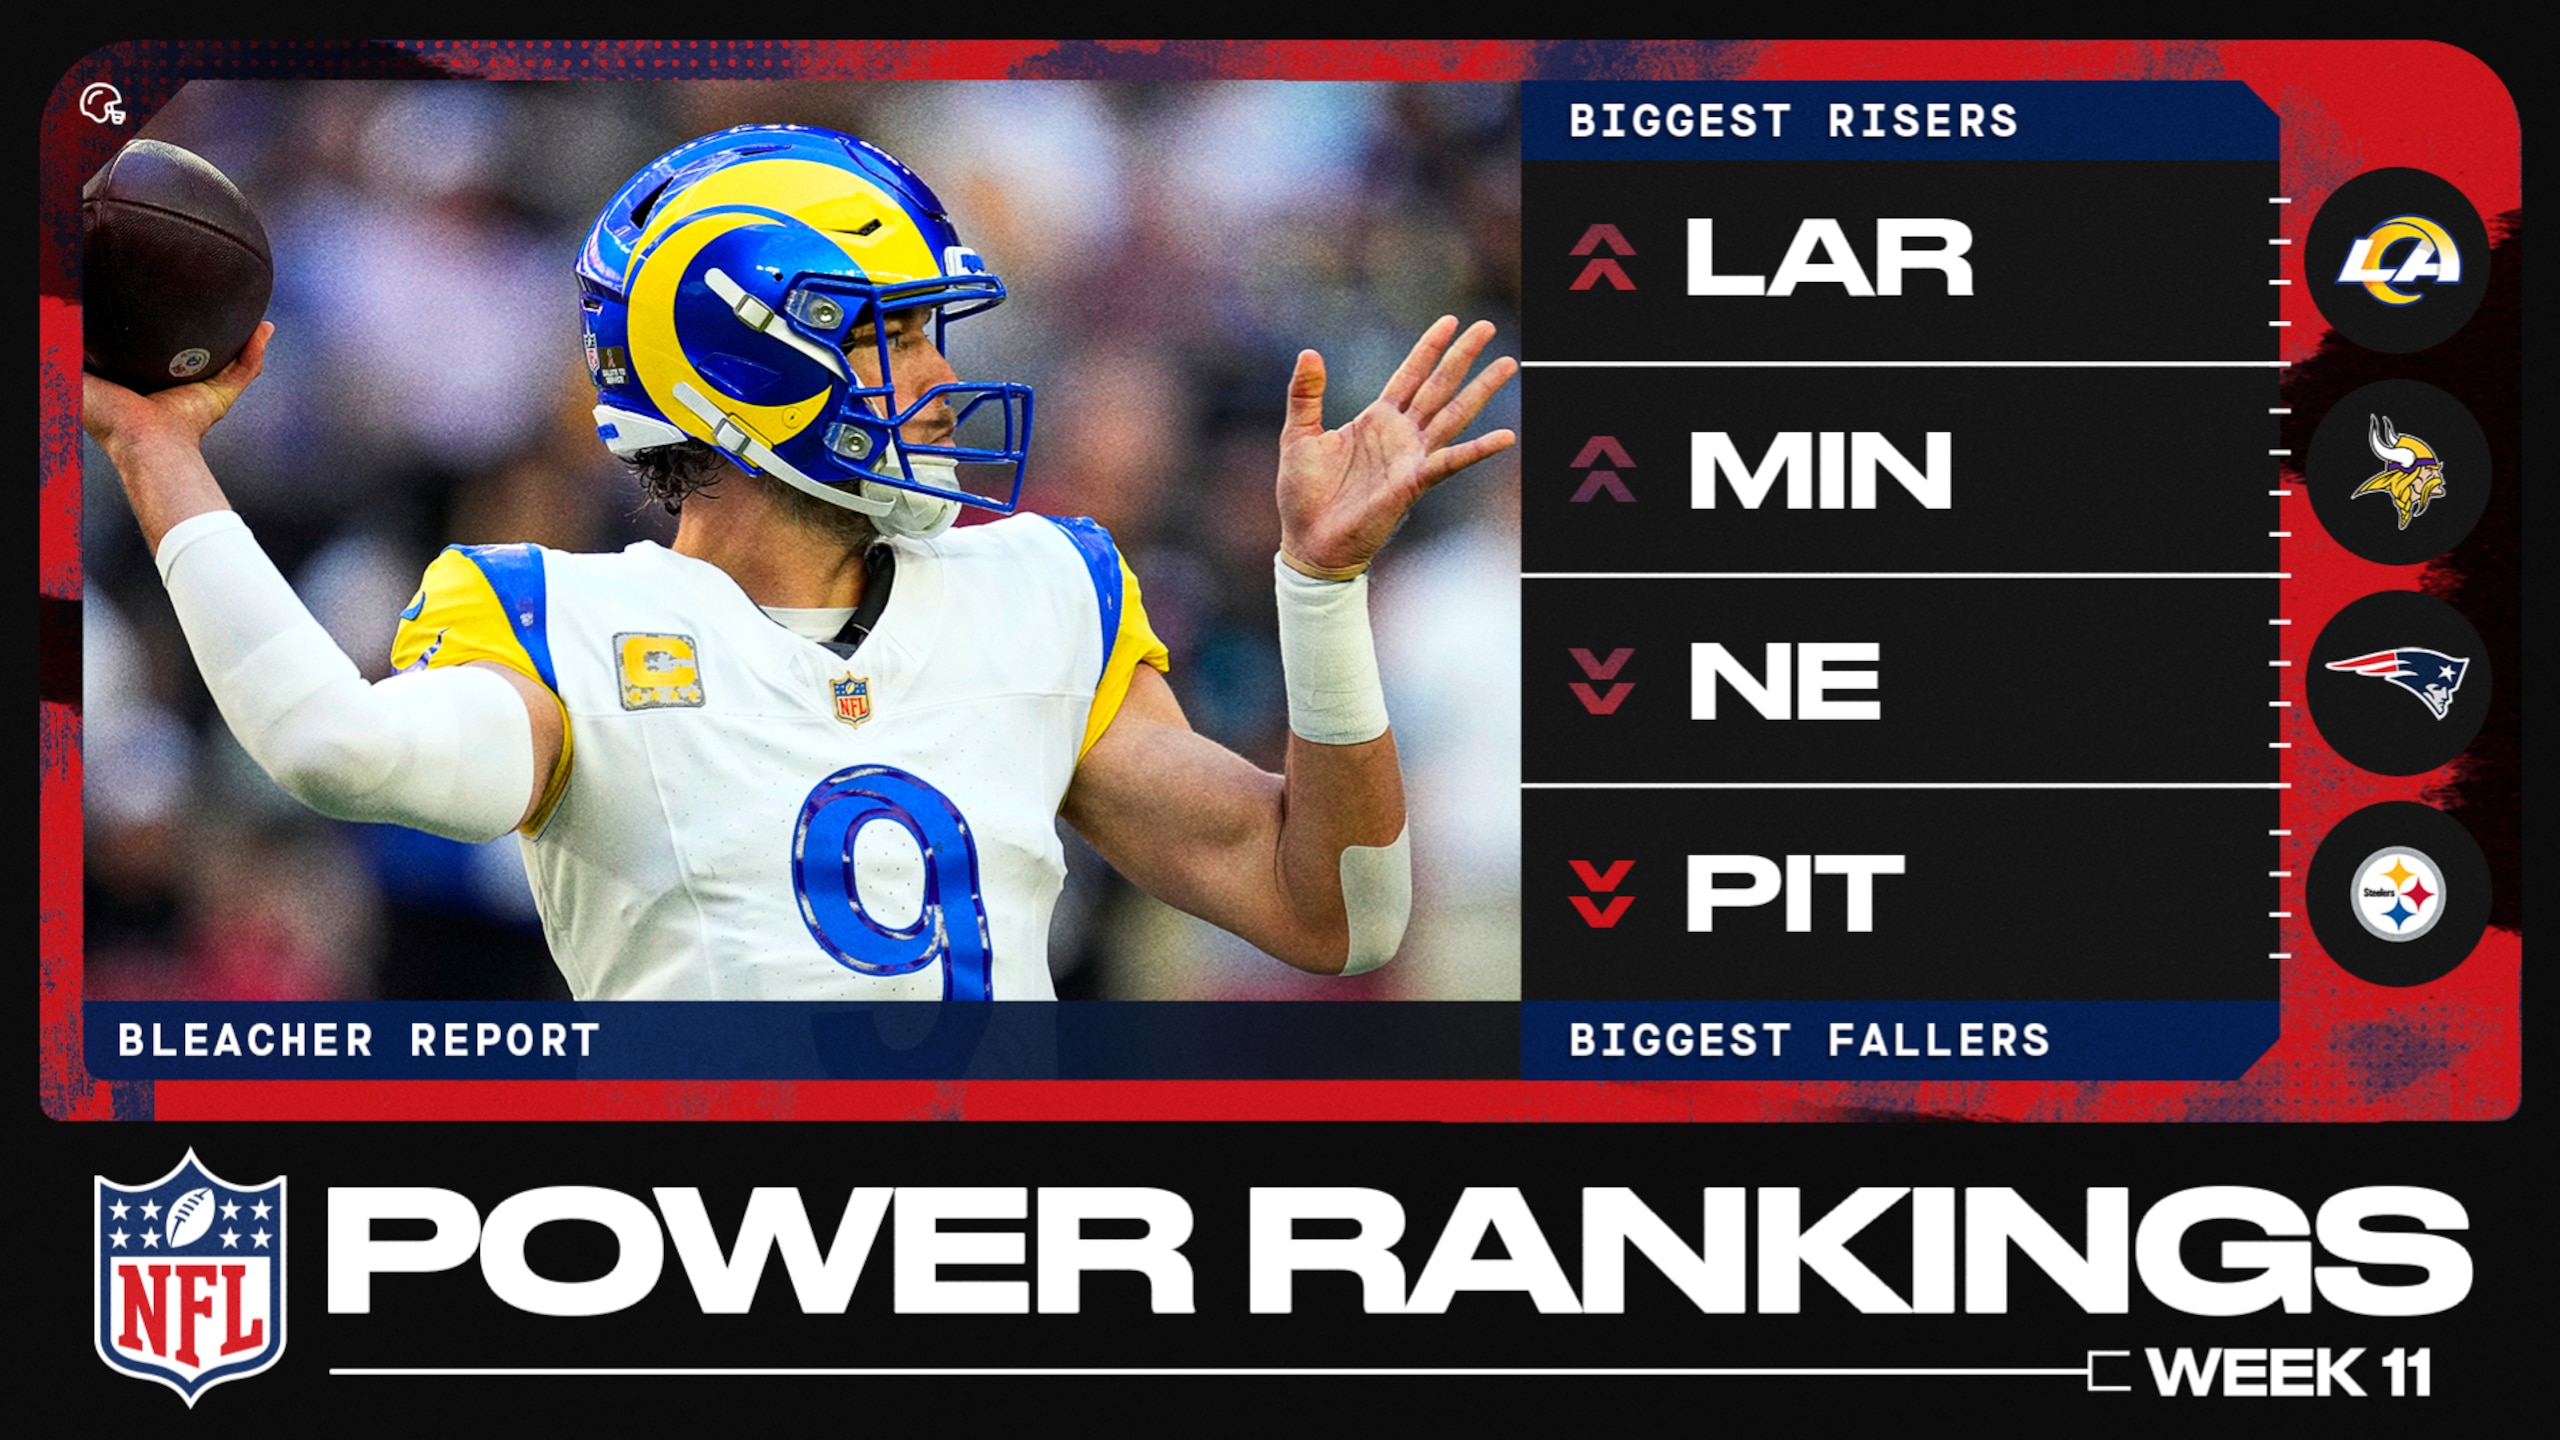
New NFL Power Rankings 📊
Ravens HC's Advice to Zay After Fumble

Comedian's Viral Manningcast Clips 😂
Quick Notes:
● The Cardinals game was hard for even the most passionate fan to watch. The Redskins played zero starters, used zero schematic/strategic planning, cared zero about anything more than looking at the last few guys on the roster and getting out of the desert healthy. Add the fact that the Cardinals played starters while the Redskins played footsie, and the stats in this one were as meaningful as the proverbial politician's touch.
That established...
For the first time in four games, the team that forced the most turnovers lost the game. The Redskins forced two against Arizona while losing only one. Final preseason W/L record of the team that forced more turnovers: 3-1.
● One serious problem area the past few seasons has been third down efficiency. If preseason indicators mean anything at all, Redskins fans can take heart in the performance of their team on both sides of the ball. In new head coach Mike Shanahan's debut preseason, the offense converted on 43 percent, while the defense held their opponents to 25. You could win a lot of games that way.
● These offensive (no pun intended) numbers from the Cardinals game may surprise you—they did me. Or at least they did until I reminded myself, one last time, that it was preseason.
Total Net Yards: Redskins 306, Cardinals 251
Net Passing Yards: Redskins 245, Cardinals 176
Net Rushing Yards: Redskins 61, Cardinals 75
Average Gain per Play: Redskins 5.5, Cardinals 4.6
And finally, so you don't think I'm just blowing feel-good smoke up your dress:
Penalties (Number-Yards): Redskins 12-110, Cardinals 4-30
You could lose a lot of games that way.
On to bigger and better things. May the forced turnover be with you.
FORCED TURNOVERS
Redskins: 2
Opponent: 1
Preseason:
Redskins: 10
Opponent: 6
3rd DOWN EFFICIENCY
Offense: 3-10 (30%)
Defense: 4-11 (36%)
Preseason:
Offense: 24-56 (43%)
Defense: 11-44 (25%)
RED ZONE (TD) EFFICIENCY
Redskins: 0-2 (0%)
Opponent: 2-4 (50%)
Preseason:
Redskins: 5-13 (39%)
Opponent: 5-11 (45%)
Bonus: this one is my own pet peeve and will be tracked, relentlessly, and with ever-increasing angst, until it is broken. As of this writing, the last Redskins' defensive touchdown came in October 2007, when the Redskins beat the Arizona Cardinals 21-19 at FedEx Field and linebacker London Fletcher picked off Kurt Warner, taking it to the house in the second quarter to give the Redskins a 14-0 lead. At least it was epic—be sure to check out his flying leap into the end zone.
For those scoring at home, that was 56 games ago (43 regular season, 12 preseason, one playoff).
DEFENSIVE TOUCHDOWNS
REDSKINS: 0
OPPONENTS: 0
Preseason:
REDSKINS: 0
OPPONENTS: 0